Category: Clinical

  • ECG Concepts: The Importance of Time and Direction

    ECG Concepts: The Importance of Time and Direction

    Often basic ECG teaching relies on teaching pattern recognition, which can work well, however when presented with an ECG that isn’t similar to a pattern you have seen, you can run in to problems.

    This article will explore two simple concepts that will hopefully help with your ECG reading and understanding of the underlying physiology:


    Looking for help with a key term? Jump to them here:

    Jump to references


    Time

    Let’s start with time. It seems simple enough.

    It can be good to think of an ECG as a graph with an X and Y axis. X, horizontally along the bottom represents time. We’ll come to the Y axis later.

    Now, we know that X is time, each small square is 40ms (0.04seconds), each large square is 200ms (0.2 seconds), 30 large squares is 6 seconds and so on. That’s reasonably straightforward, but how does it relate to physiology?

    Let’s imagine that graph again. And let’s imagine some boxes drawn on. Don’t worry about the Y axis value for now.
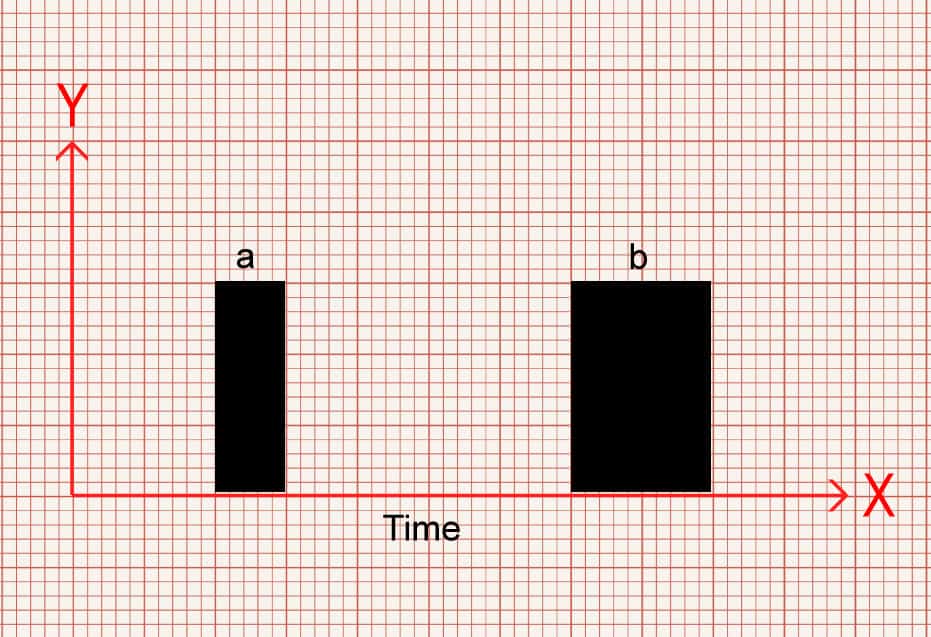
    In image 1 you can see a narrow box (a) and a wider box (b). Which one would you say takes up more time? Which one takes up less time?

    Box b takes up more of space along the X axis so therefore takes up more time. Box a covers less space on the X axis so takes less time.

    Similarly, we can measure between two points. Look at Image 2. You can see two horizontal lines of different lengths. The gap between a – b  is shorter than c -d. So again, which takes up more time?
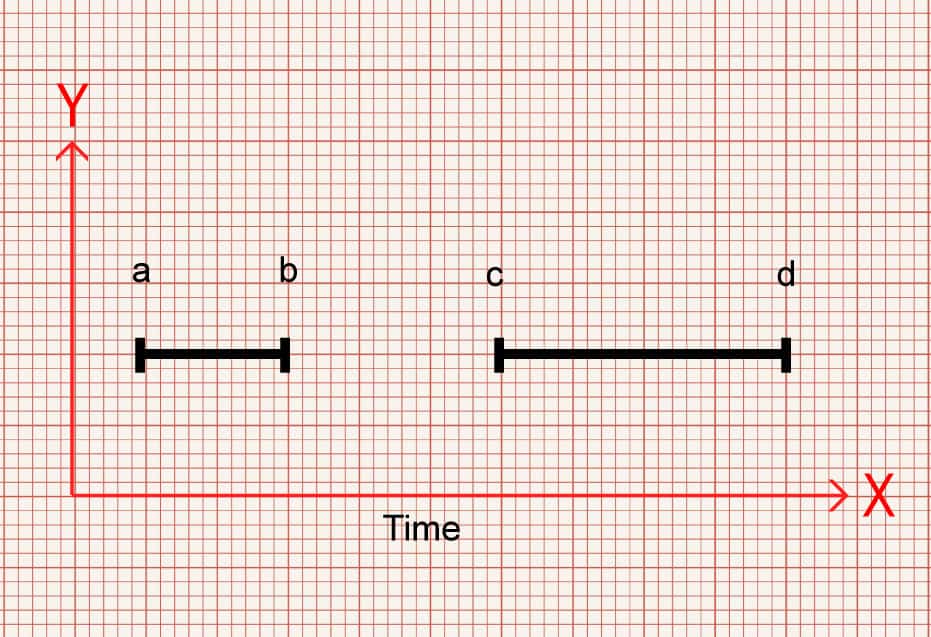
    Gap c-d is wider, takes up more of the X axis and therefore takes up more time.

    Stay with me.

    Now, let’s replace those boxes with QRS complexes.

    In image 3 there is a narrow QRS (a) and a wider QRS (b). Which one takes up more time?
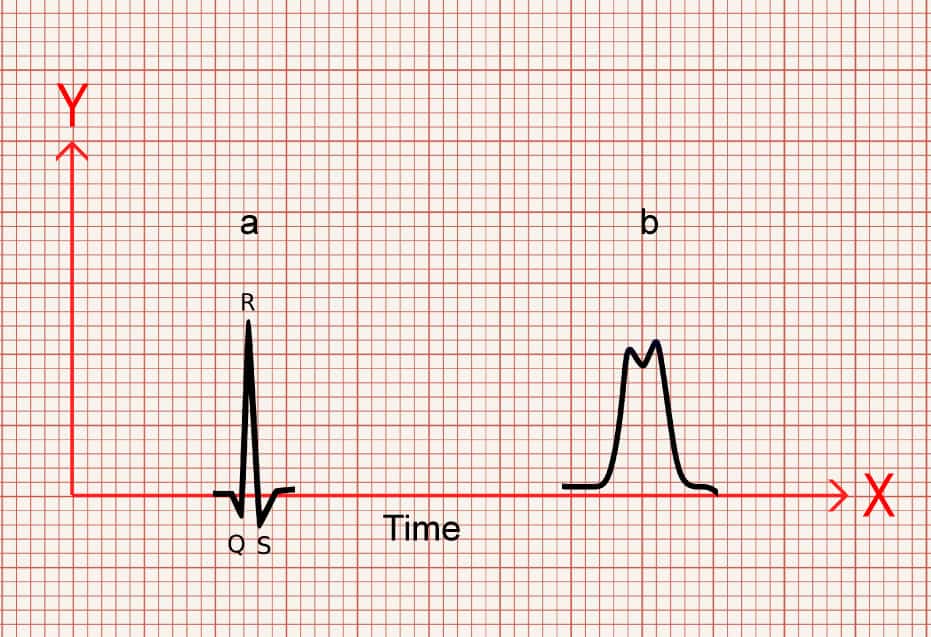
    B is taking up more of the X axis so takes more time.

    And again, once more, let’s look at some gaps between two points, but let’s show it as the gap between the P wave and QRS. Which one takes up more time and which takes up less time?
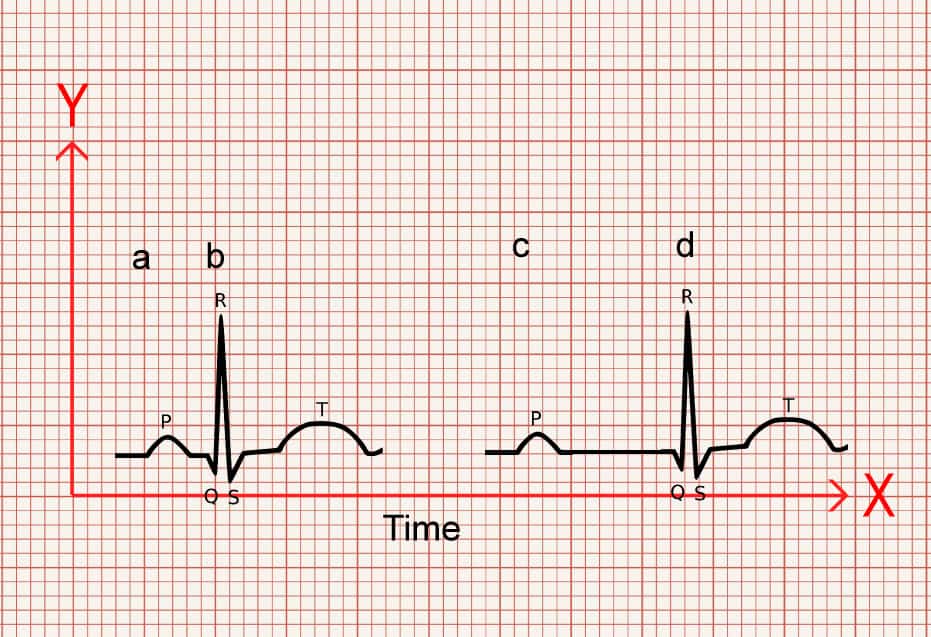
    The gap between a-b is shorter than c-d.

    So c-d takes up more time.

    Probably not ground breaking.

    But, what’s another way of thinking about the time something takes? If something takes up more time, you could also say that it is slower, and if something takes up less time, its faster.

    Now, remember that an ECG is dealing with electrical conduction.

    If on an ECG something is taking up more space along the X axis, therefore taking more time, and is therefore slower, then it makes sense that there is a problem effecting its ability to conduct!

    And poor conduction is the underlying issue that what we see in AV blocks and bundle branch blocks.

    So if you see a QRS or PR that is wider than normal values, think, something is causing it to be slower and that there is a conduction fault.

    Equally if you see a PR interval that is narrower than it is meant to be, taking up less space along the x axis and therefore less time, think, it’s conducting faster than it should and it would alert you to pre-excitation problems, such as accessory pathways in Wolff-Parkinson-White syndrome (WPW effects both the PR interval making it shorter, and has a wider QRS).

    Direction

    Now, let’s talk about direction.

    We know by looking at the ECG paper that vertically, the small boxes, measured in mm, represent millivolts (mV) – a measure of force (sort of). Each 1mm = 0.1mV, 10mm = 1mV. This also means that it has what’s known as magnitude – or size.

    Now, let’s look at the graph again. We know the X axis is time, as discussed above. However, in an ECG the X axis is not simply the bottom, but instead the middle of the graph, with the Y axis extending both positively above the X, and negatively below the X axis.
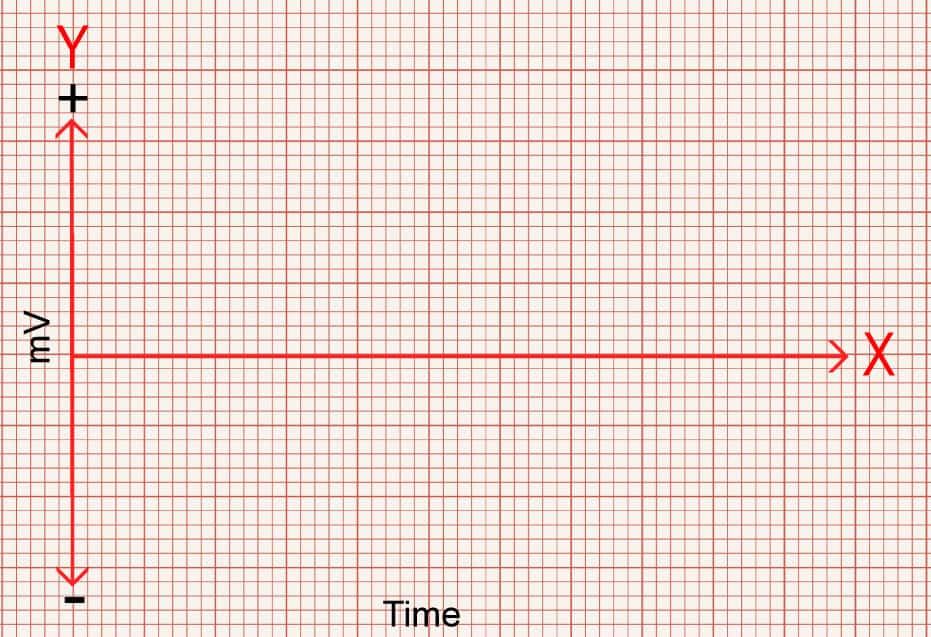
    The X axis can have readings above or below it. This is the isoelectric line.

    ECGs pick up electrical charge moving across the heart. And it does so by placing electrodes at different locations around the heart.

    As shown in the diagram below, the electrodes create a view of the heart from different angles, and each view is called a lead. 12 leads (views), but only 10 wires.

    The chest leads look at the heart across the transverse plane, that is from the front of the chest to the back, whereas the limb leads look at the heart in the frontal plane, which are essentially from the sides, top and bottom.

    The angles the leads look at the heart are measured in degrees, with lead i being the reference point of 0°.

    This is something that is worth learning so that you are able to visualise where each lead “looks”.  
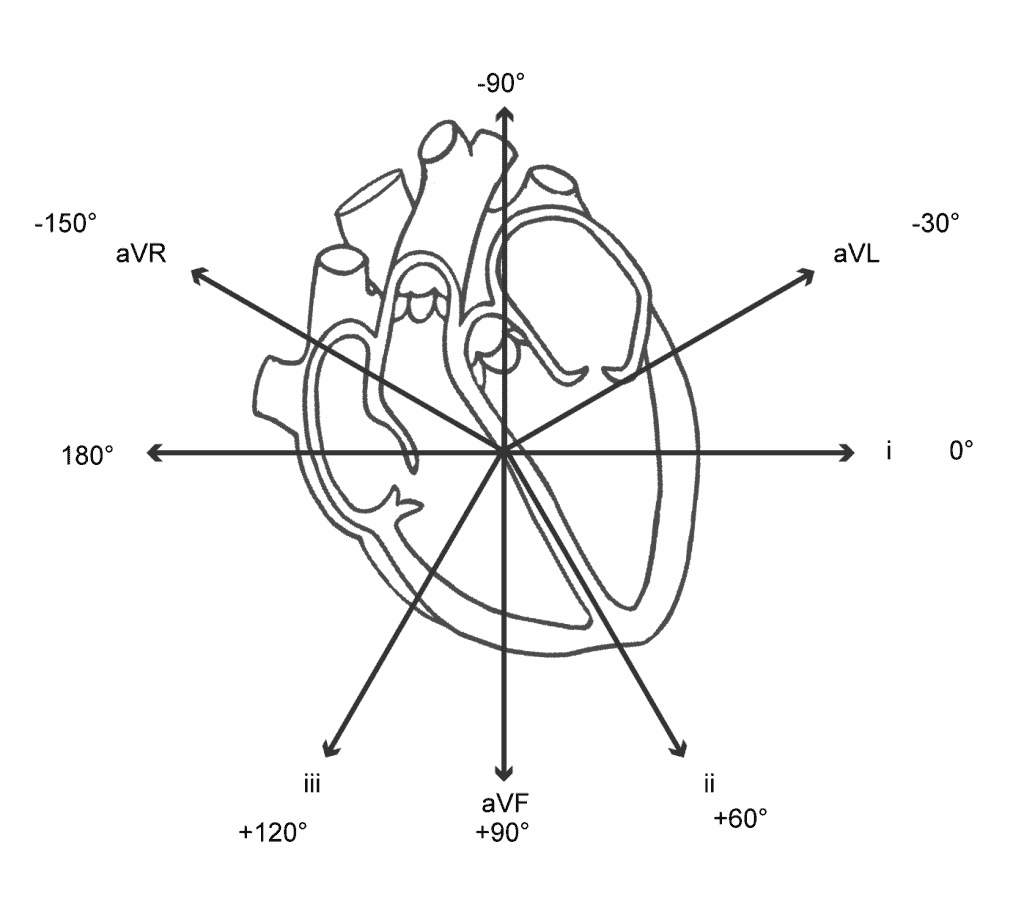
    Roughly speaking, the limbs leads create the following views of the heart.

    • avR – Looks from the Right shoulder to the left hip
    • aVL – Looks from Left shoulder to right hip
    • i – Looks from the left mid axilla similar to V6
    • ii – Looks from the left hip to right shoulder
    • aVF – Looks from the Feet up to the head
    • iii – Looks from the right hip to the left shoulder
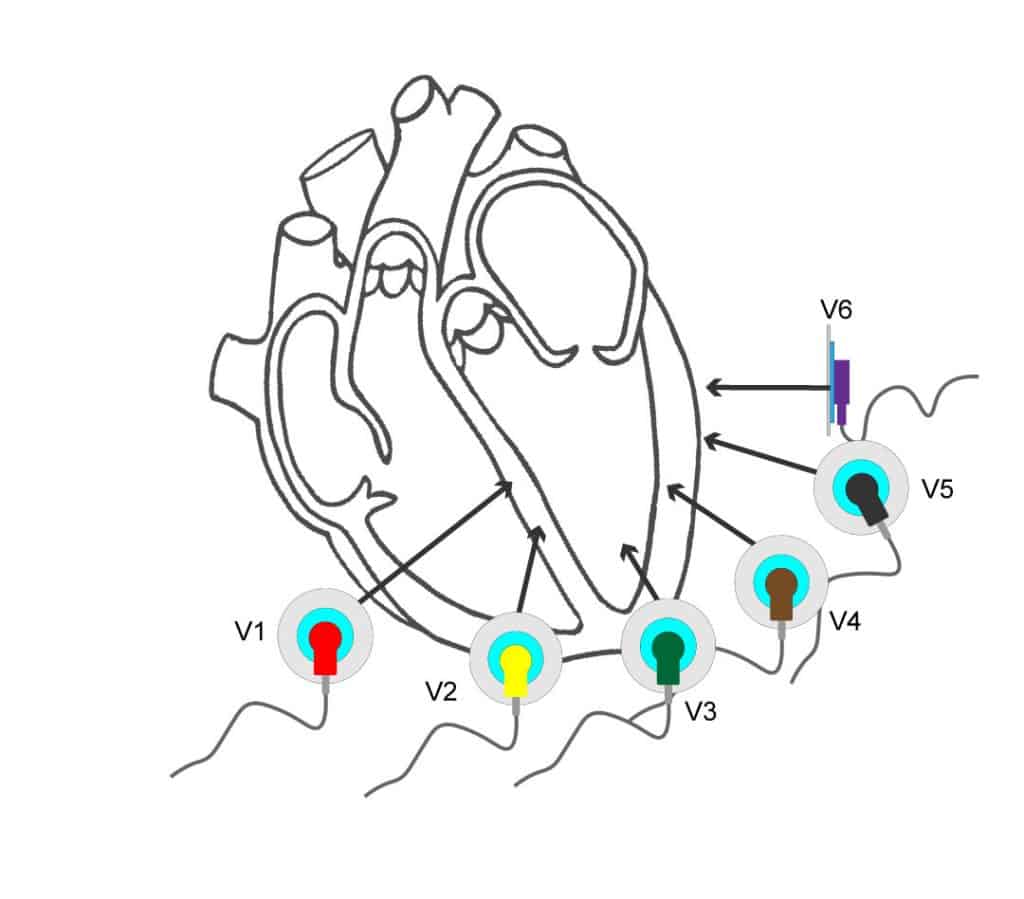
    The chest leads create views from the chest wall through to the back

    • V1 + V2 – intraventricular septum
    • V3 – V4 – anterior wall of the left ventricle
    • V5 – V6 – lateral wall of the left ventricle

    Very simply put, as an electrical charge moves towards an electrode position, this creates a positive reading. As it moves away it creates a negative reading.

    Electrodes that are opposite to each other, 180 degrees apart, will be mirrored. One will have charge moving towards it, creating a positive deflection and the opposite side will show a negative deflection as the charge moves away from it.
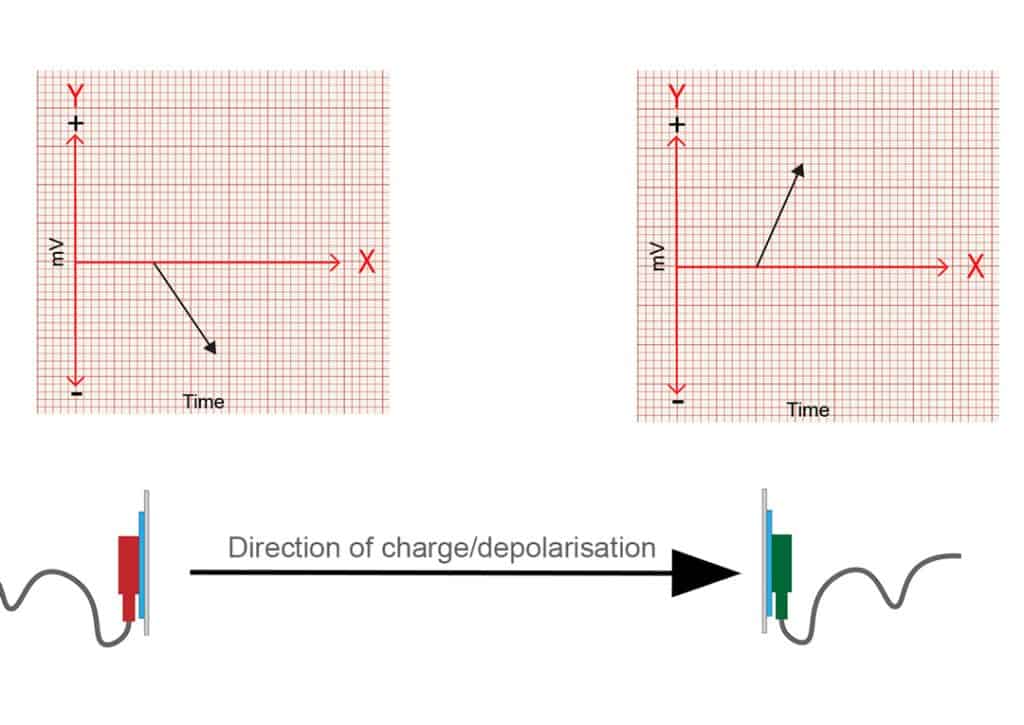
    Leads at 180° from each other.

    Slightly more complicated is what happens when the electrical charge isn’t moving directly to, or away from the electrode, but when it is moving at more or less than 180 degrees to the electrodes position.

    Let’s look at what happens when it moves at 90 degrees to the electrode first.
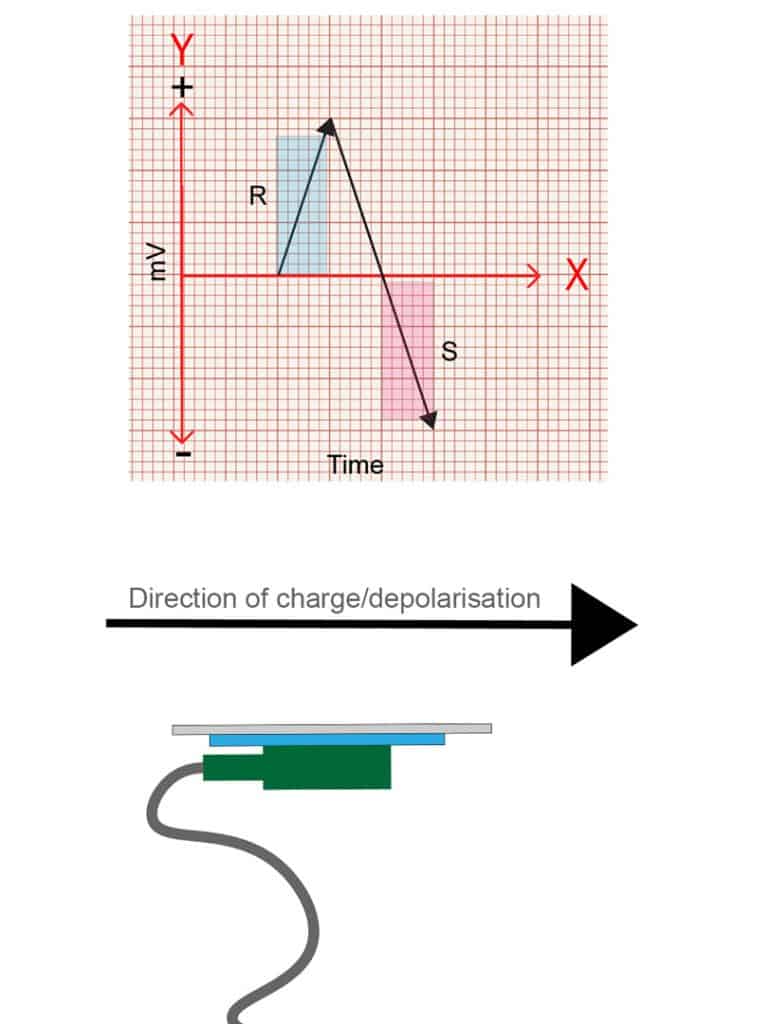
    When the charge is moving at 90 degrees, or perpendicular, to the position of the electrode, it  has both a period of positivity and a period of negativity, as the charge moves towards and then away from the electrodes position as it passes by. This is represented on an ECG as an R wave followed by an S wave of equal magnitude.

    Quick tip – an R wave is any positive deflection you see, and an S wave is a negative deflection following an R wave BUT it must cross the isoelectric line to be considered negative. The segment from the top of the R wave back to the isoelectric line is not the S wave. The S wave is only the portion below the isoelectric line.

    Hopefully this is starting show the relationship between the direction of the charge and the position of the electrode.

    So, what happens if the charge moves at 45 degrees to an electrode’s position? Well, it’s a bit more towards the electrode than 90 degrees, but not straight on. So the tracing will show a predominately positive wave, with a smaller S wave. The opposite will be true if travelling at say 135 degrees away from an electrode.
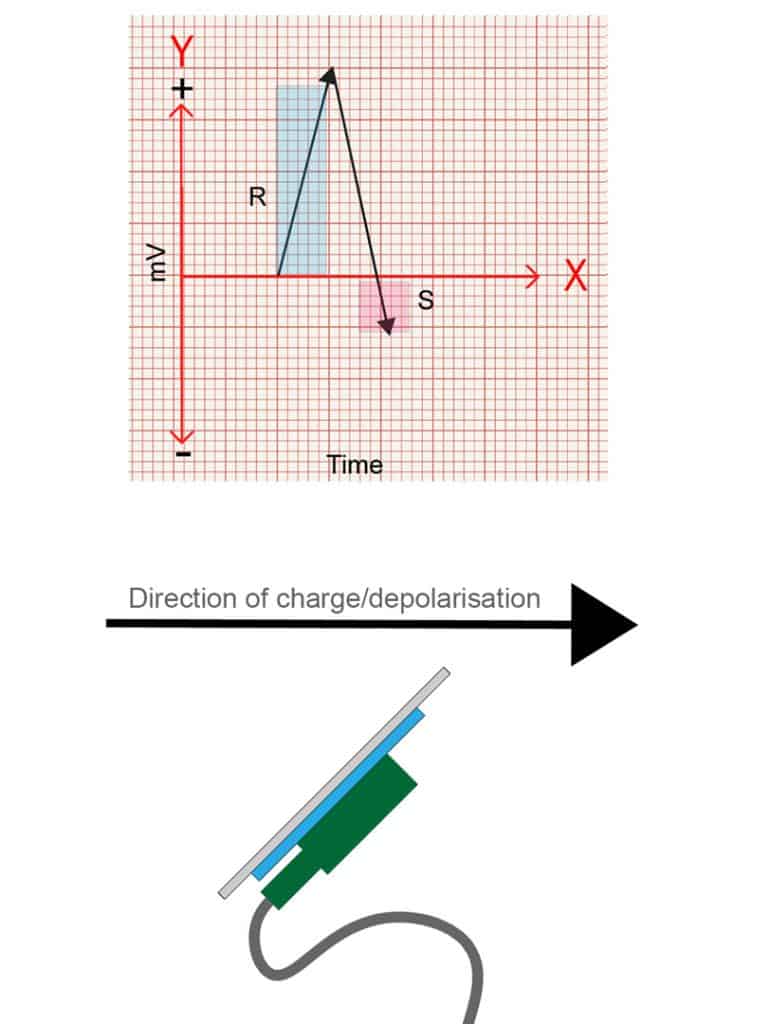
    Hopefully you can see then, that by varying the direction the charge travels, you’ll get different combinations of positive and negative deflections, and that it is relative to the position of each lead/view!

    This means that the waves on an ECG not only have a value in magnitude (mV), but also direction. This combination of magnitude and direction is known as a vector.

    So not only can the ECG waves tell you the charge in volts, but it can also show you the direction that charge is moving relative to the electrode placement.

    Why is this important?

    Well, many of the pathologies we come across effect the direction the charge moves across the heart.

    For example, in left bundle branch block (LBBB), the left conduction pathway is faulty. This means all of the electrical charge must come from the right side of the heart, and travels across the heart from right to left through the slower conducting muscle tissue.
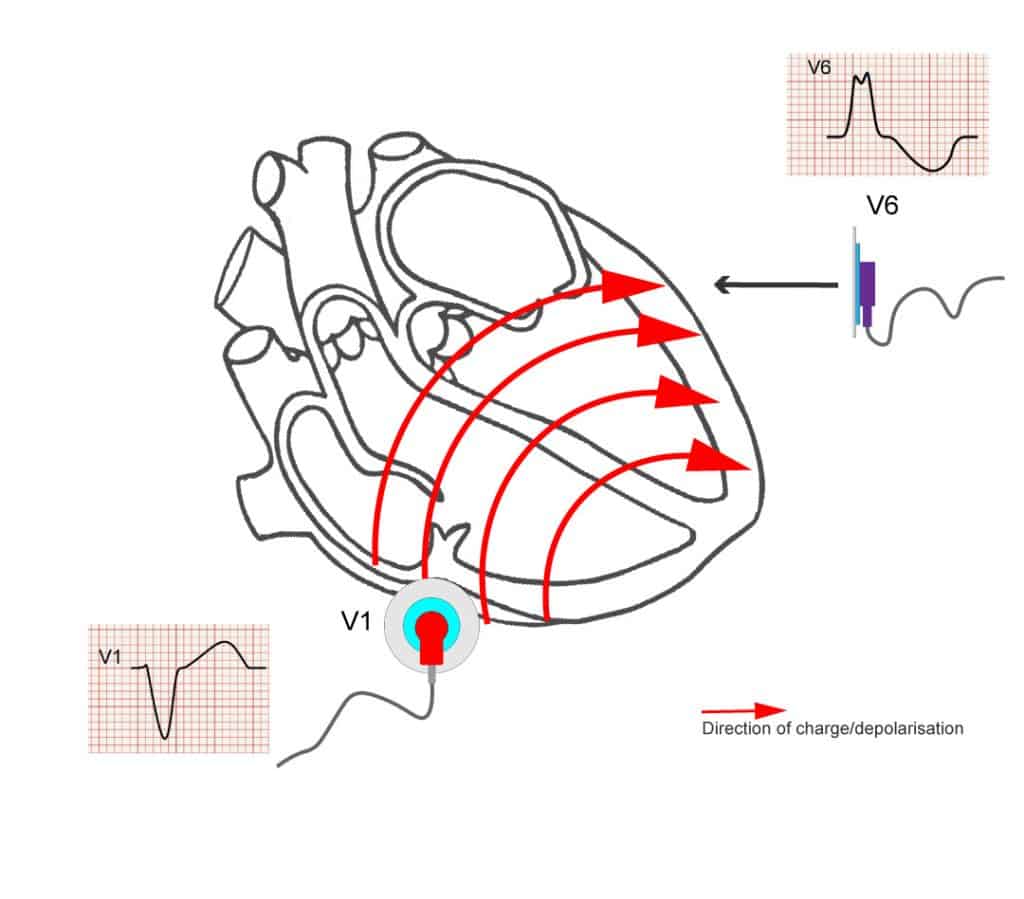
    V1 looks at the right side of the heart, so, with right to left movement, the charge is moving , slowly, away from V1, giving the classic negative, deep S wave seen in LBBB.

    Understanding the concepts of vectors is important if you want to understand axis deviation, reciprocal changes in STEMIs, left anterior and left posterior fascicular blocks, T wave inversions and strain patterns, and how to identify bundle branch blocks.

    Final Notes

    So, to sum up, understanding how time is displayed on the ECG will lead to better recognition of conduction faults. Understanding that the ECG shows both direction and magnitude means you can easily understand how that charge is moving across the heart. Couple this with further reading around the physiology and pathophysiology and your ECG interpretation should greatly improve!

    Just as a final caveat: electrophysiology is complicated. This is a basic description of the principles and vectors, but the images are not exact examples. The detailed process of how the electrodes work, how the leads form their views, the physics behind it and so on are far beyond the scope of this article, but hopefully this has given some insight into the applied nature of ECG.

    References

    The above post is written by an Article999 contributor and contains a mix of original content and explanations based on the below sources. All images are combined from licensed Adobe Stock images and the author’s own work, as with all Article999 content.

    Cadogan, M. And Buttner, R. 2022. ECG Axis Interpretation. Available at: https://litfl.com/ecg-axis-interpretation/ (Accessed 19/01/2023).

    Cadogan, M. 2021. PR Interval. Available at: https://litfl.com/pr-interval-ecg-library/ (Accessed 19/01/2023).

    ECG Waves, n.d. Cardiac electrophysiology: action potential, automaticity and vectors. Available at: https://ecgwaves.com/topic/cardiac-electrophysiology-ecg-action-potential-automaticity-vector/ (Accessed 19/01/2023).

    ECG Waves, n.d. Left Bundle Branch Block (LBBB): ECG criteria, causes, management. Available at: https://ecgwaves.com/topic/left-bundle-branch-block-lbbb-ecg-criteria-treatment/ (Accessed 19/01/2023).

    ECG Waves, n.d. The ECG leads: electrodes, limb leads, chest (precordial) leads, 12-Lead ECG (EKG). Available at: https://ecgwaves.com/topic/ekg-ecg-leads-electrodes-systems-limb-chest-precordial/ (Accessed 19/01/2023).

    ECG Waves, n.d. The QRS Complex: ECG features of the Q-wave, R-wave, S-wave & duration. Available at: https://ecgwaves.com/ecg-qrs-complex-q-r-s-wave-duration-interval/ (Accessed 19/01/2023).

    Garcia, T. 2013. The Art of ECG Interpretation. 2nd ed. Jones and Bartlett Publications, Inc: Massachusetts.

  • End of Bed Assessment – 16 Reasons Your Patient is Pale

    End of Bed Assessment – 16 Reasons Your Patient is Pale

    Here’s a list I’ve had for a while but not published: obvious, less obvious, and utterly surprising reasons your alive patient might be pale. References within. Detailed reference list coming soon.

    Image above – a person with vitiligo (Source: Adobe Stock)
    1. Shortness of breath (which may also be due to anaemia) – https://www.ncbi.nlm.nih.gov/pmc/articles/PMC2996160/
    2. Distributive, Cardiogenic, Obstructive + Dissociative shocks (Pilbery & Lethbridge, 2016: 247)
      • Including SOB/DIB, PE, pneumothorax, anaphylaxis
    3. Lung disease, leading to central cyanosis (Douglas et al, 2013: 45) including asthma and COPD (exacerbations & chronic)
    4. Acute myocardial infarction – https://patient.info/doctor/acute-myocardial-infarction
    5. Heart failure – https://em.osumc.edu/education/journalClub/SignsandSymptomsofHeartFailure.pdf
    6. Shock, caused by hypotension – https://www.nhlbi.nih.gov/health-topics/hypotension
    7. Vasovagal – ‘Facial pallor is often the first sign of an impending vasovagal faint’. https://academic.oup.com/brain/article/132/10/2630/329792>
    8. Shock – hypovolaemia – https://artifactsjournal.missouri.edu/2016/04/hypovolemic-shock-and-fluid-resuscitation/
    9. Lingual Raynaud Phenomenon – leading to a white tongue, temporarily – http://www.cmaj.ca/content/188/15/E396
    10. Drugs – Amiodarone can cause a ‘bluish-grey’ skin discoloration (Douglas et al, 2013: 44)
    11. Vitiligo (segmental and non-segmental) due to the lack of melanin, causes ‘pale patches of skin’ (Douglas et al, 2013: 46); non-segmental vitiligo ‘is thought to be an autoimmune condition’ (NHS – Vitiligo)
    12. Albinism (Douglas et al, 2013: 46)

    Discoloration of the hands/nails/eyelids:

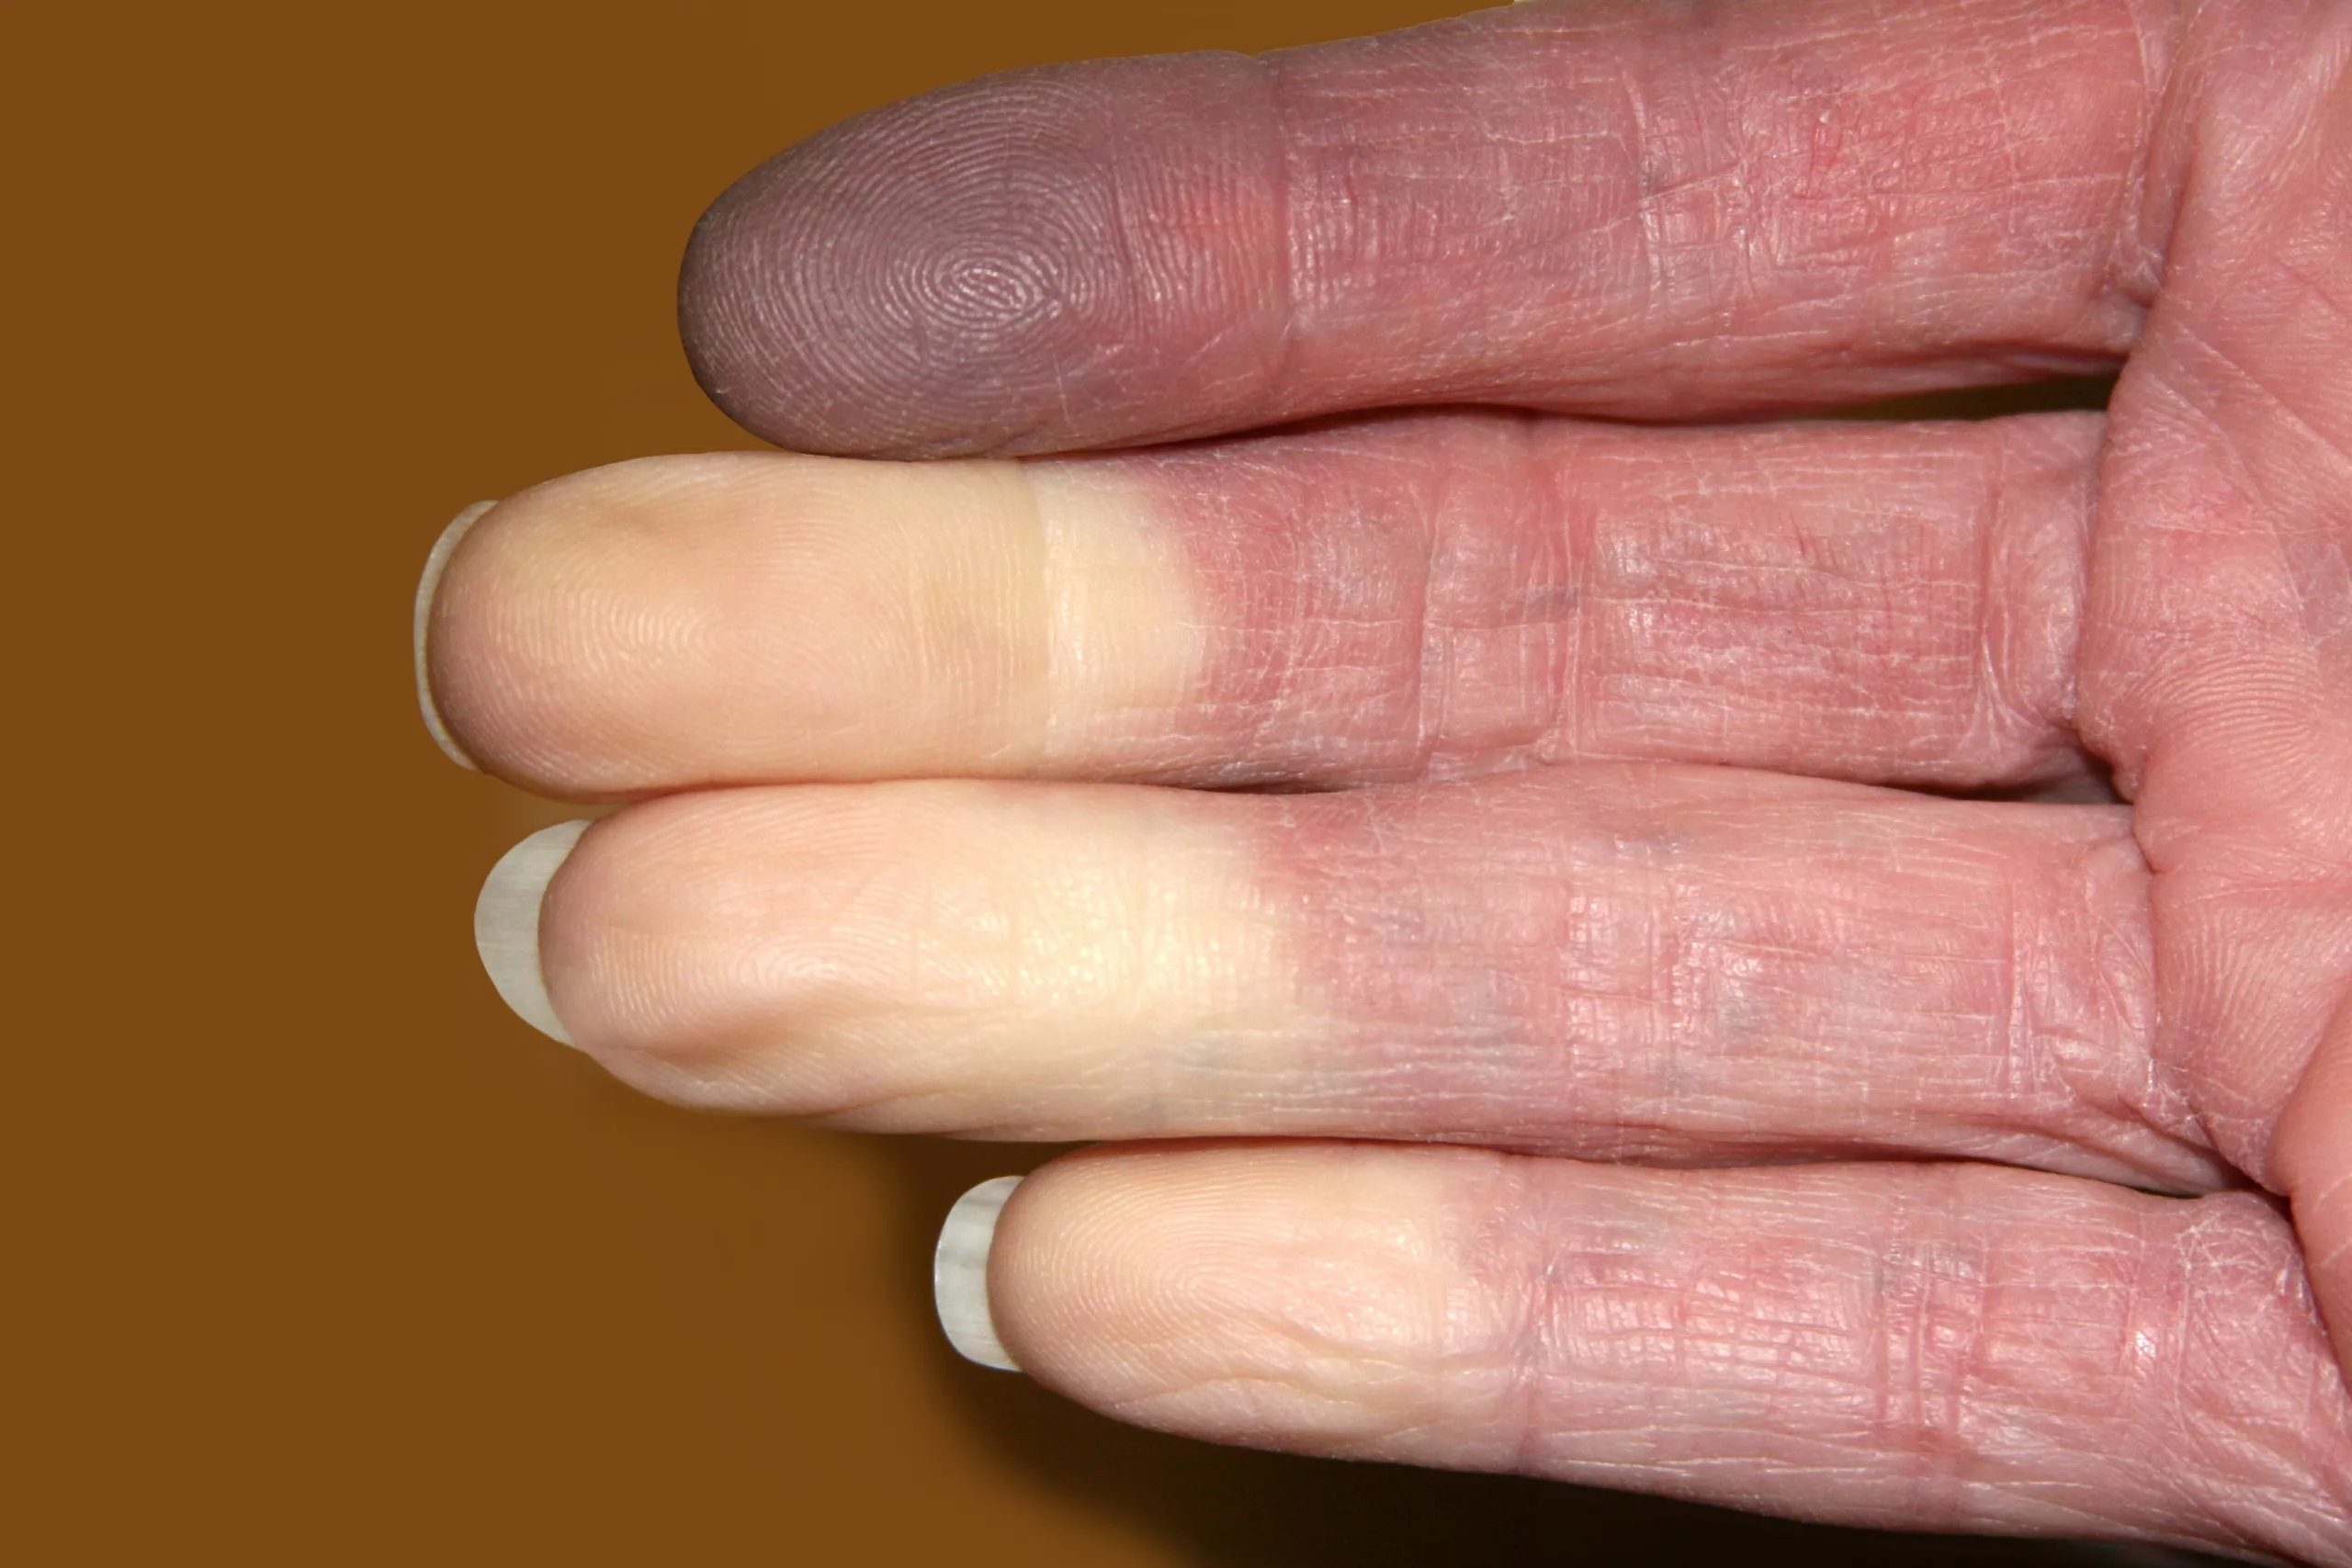
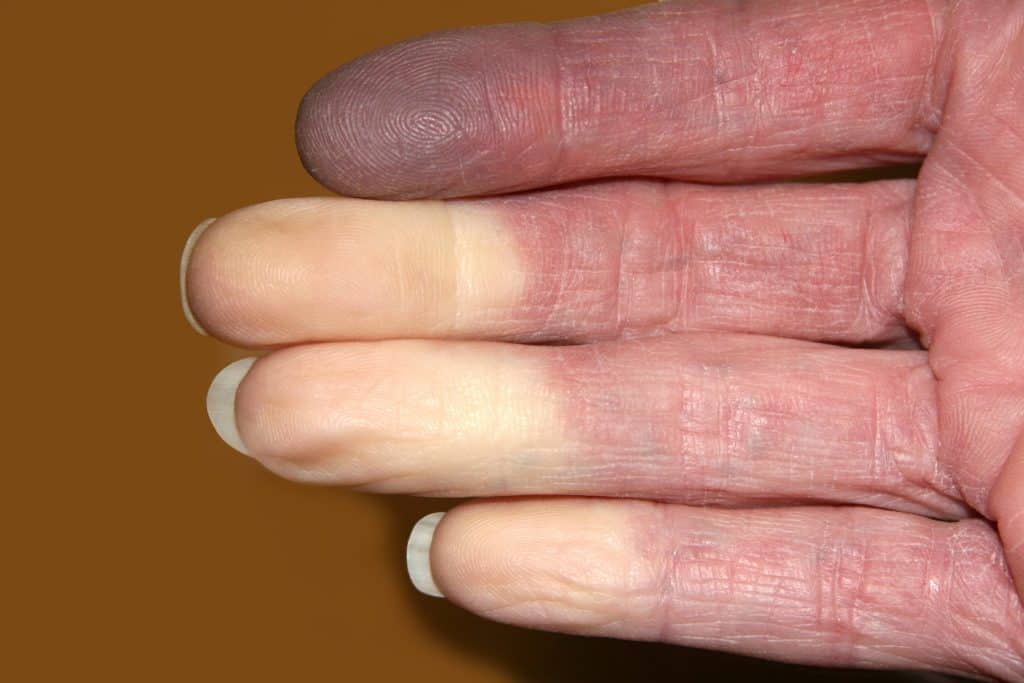
    Photo above demonstrates reynauds (Source: Adobe Stock)

    13. White discoloration of nails – 6 of 155 HIV patients in a 1998 study had this, amongst other more prevalent changes of their nails  – https://jamanetwork.com/journals/jamadermatology/fullarticle/189490

    14. Anaemia – ‘pallor of the conjunctiva, palm, nail beds or at any site was associated with a significantly lower hemoglobin concentration’ – From <https://academic.oup.com/jn/article/129/9/1675/4721973>

    15. Raynaud Phenomenon – leading to white/yellow/purple fingers, temporarily – http://www.cmaj.ca/content/188/15/E396

    Red herring

    16. Rigor mortis and liver mortis in an alive patient who was suffering from a dissecting abdominal aorta: https://content.sciendo.com/view/journals/sjfs/22/1/article-p11.xml

    Have I missed any? Add in the comments below —>

  • Demo – Sizing an Oral Airway Adjunct – GIPHY (Quick View)

    Demo – Sizing an Oral Airway Adjunct – GIPHY (Quick View)

    https://giphy.com/gifs/opa-oral-airway-adjunct-8HxbiSgO7sUT6DDZiz
  • Article 999 Founder Published in Paramedic INSIGHT Magazine, Sep 2022: Functional Neurological Disorder – A Patient’s Experiences; A Paramedic’s Perspective

    Article 999 Founder Published in Paramedic INSIGHT Magazine, Sep 2022: Functional Neurological Disorder – A Patient’s Experiences; A Paramedic’s Perspective

    Earlier this year I had the pleasure of speaking with a patient with Functional Neurological Disorder (FND). Ailsa reached out to the College of Paramedics after experiencing an unsettling mixture of treatment by healthcare professionals in a variety of settings. She hopes to encourage healthcare clinicians to learn more about her condition, a functional neurological disorder. Our understanding of this group of conditions is currently being reshaped, so I agree it is another area in which we must stay up-to-date.

    The publication of this post on Article 999 comes at a timely moment as just two days ago I read here that a study published in Epilepsy and Behaviour has documented MRI changes in patients with functional seizures. This furthers the point that what science and medicine thought it knew about this – and perhaps other conditions – while not fiction, is also not yet fact.

    Members of the College of Paramedics can read the published article in last month’s issue of Paramedic INSIGHT or online here.

  • Recommended Content: Cardiac Action Potential, Explained with Dominoes

    Recommended Content: Cardiac Action Potential, Explained with Dominoes

    If you, like me, struggle to understand the action potential, here is a great video from UBC Medicine, which explains the concept with dominoes. Check it out below.

    Credits: UBC Medicine
  • Interpreting the Acid-Base Balance Using Tic Tac Toe (0s and Xs)

    Interpreting the Acid-Base Balance Using Tic Tac Toe (0s and Xs)

    This information is taken from an excellent video by Radiometer, shown here:

    Put Simply:

    To interpret the acid-base blood gas results, you first need to know what normal levels are – and be careful, because there are international variations in what units we use, and you may also find slight variations in results. You also need to know what a high figure means vs a low figure – is this acidemia, or alkalemia? Let’s help you out:

    Your normal levels are:

    Ph = 7.35-7.45

    Pc02 = 4.7-6.0 kPa

    Hc03 = 22-26 mmol L

    Which way is acid, and which way is alkaline?

    You might notice that respiratory acidosis and respiratory alkalosis are in bold. That is to highlight the fact that these are opposite to the other parameters – a high pC02 = acidotic. A low pC02 – alkalosis. One simple way to remember this is to try to spell ‘opp’ (opposite) backwards, using the other parameters. To enable you to do this, you’re only allowed to swap one C for a P. Go ahead, try it.

    For pH, you obviously can’t do this.

    For HC03, you still can’t: Even if you change the C to a P, you still have an H in the way.

    For pc02, you can swap the C for a P and you can spell: 0PP backwards… That’s the parameter that is opposite to the others!

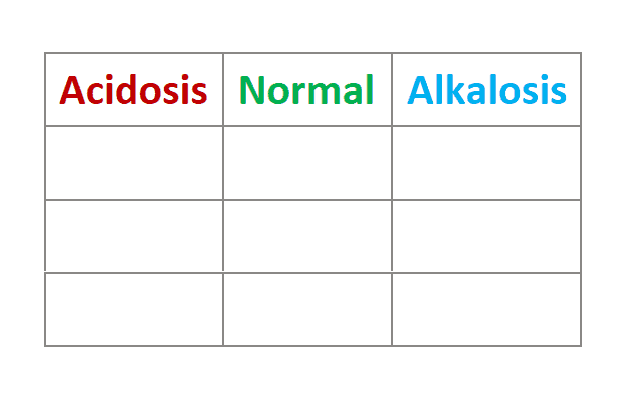
    How to Use Tic-Tac-Toe (0s and Xs)

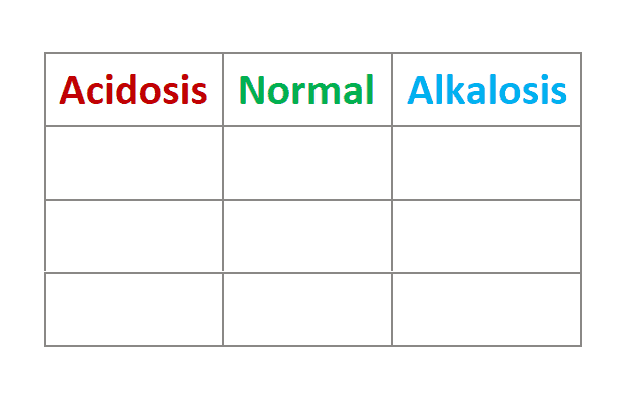
    First, draw a tic-tac-toe table like so.

    Next, put your pH into the acidosis, normal, or alkalosis column:

    AcidosisNormalAlkalosis
    pH 7.12  
      

    Next, put your HC03 or pC02 into the corresponding column. In this case, it’s the pC02:

    AcidosisNormalAlkalosis
    pH 7.12  
    pC02 13.9  

    It only takes 3 in a row for tic-tac-toe, and that includes the title, so you have an acidosis here. Because we are looking at the respiratory component (pC02), this is a respiratory acidosis.

    But we keep looking because we want to know if the body is trying to compensate. If it is, the opposite component – in this case, the metabolic component, HC03 – will be going in the opposite direction to the general trend. In this case, the general trend is respiratory acidosis, so we’re looking to see if the metabolic component is alkalotic. If there is no compensation, it will be in the normal range.

    AcidosisNormalAlkalosis
    pH 7.12  
    pC02 12  
      HC03 33

    And it’s above the reference range, so there is partial compensation here. But it’s only partial compensation because the pH isn’t normal.

    AcidosisNormalAlkalosis
     pH 7.36 
    pC02 11  
      HC03 33

    This is now fully compensated. We know it was probably respiratory acidosis before because a) we have the luxury of repeat blood gas results, and b) the pH is only just normal; in fact, it’s heading towards acidosis. We need to keep monitoring to see if this continues to normalise or if it heads in the wrong direction.

    You can use tic-tac-toe to identify respiratory or metabolic alkalosis or acidosis, mixed alkaloses/acidoses, and partial and full compensation. Don’t forget to look at other parameters as well though – more on those soon.

    References

    For this post, the video above, and:

    Thompson, D. A. 2007. Blood Gases Made Simple, Easy, and Quick. Lulu Press.

  • The Case of Anna Bagenholm

    The Case of Anna Bagenholm

    In 1999, Anna Bagenholm survived a cardiac arrest after a prolonged down-time and a temperature of just 13.7c. The circumstances of her survival continue to make international news and to inform and inspire research about target temperature management. There have been very few documented cases of survival from such extreme hypothermia, especially with minimal neurological impact. Consider the statistics on neurological impact from ordinary cardiac arrests, with less down-time, and Anna’s case becomes even more extraordinary. But does her survival mean we should target hypothermia in cardiac arrest patients? Should we target hypothermia in ROSC? Let’s have a look at the case and the research that has followed:

    The case

    Situation: 29 Year Old Female (Anna Bagenholm) is submerged head-first in a hole in the ice in a mostly frozen stream for 80 minutes.

    Background: She has no medical history. She has slid down an icy slope while skiing with colleagues.

    Assessment: She was conscious for the first 40 minutes, but has been unconscious for 40 mins since. After recovery, she is in cardiac arrest. Her ECG shows asystole. During the resuscitation attempt, the following is also learned:

    • Temp: 13.7
    • Pupils: dilated

    She is warmed and the resuscitation team are watching an echo of her heart, which begins to move. ROSC was not gained until 4 ½ hours after she fell, and she spent 35 days on life support.

    Questions: What would your expectations be of her ROSC management? What would your expectations of her survival and neurological impact be?

    Recommendation — today:

    • Maintain a target temperature at a constant value between 32°C and 36°C for at least 24 h. 
    • Avoid fever (> 37.7°C) for at least 72 h after ROSC in patients who remain in coma. 
    • Do not use pre-hospital intravenous cold fluids to initiate hypothermia. 

    (Resuscitation Council, 2021)

    Decision/Outcome: Not only does Anna survive, her long-term neurological impact is minimal. Have a look at the video:

    More Questions:

    • What target temperature does your Trust follow for ROSC management? Do you think it should be lower, or higher, having seen Anna’s case?
    • Do you think it’s possible to replicate the results of Anna’s treatment? What makes her situation so different to a cardiac arrest patient who has been treated with target temperature management?

    The Research

    Have a look at the results of some recent studies into target temperature management, below:

    YearIn or out of hospital studyPresenting rhythmTargetsOutcome  
    2002OHCAShockable33 and 37Positive for survival and neurological impact
    2010OHCAShockableCooled IV fluids (No target temperature listed)No difference
    2013OHCABoth shockable and non-shockable, but presumed cardiac cause33 and 36No difference
    2014OHCABoth shockable and non-shockable2L of normal saline at 4 degrees, vs standard careNo difference
    2018OHCAShockable32, 33, 34No difference
    2019OHCA and IHCANon-shockable33 vs 37.5Improved survival and good neurological outcome (CPC = 1 or 2)
    2021OHCAPresumed cardiac cause33 vs 37.5No difference
    Adapted from: Rasmussen and Girotra, 2021.

    Final discussion point:

    Why can’t controlled studies replicate the kind of outcome that Anna had? Share your thoughts below, or on our Facebook or Twitter pages.


    References (excluding videos and direct links above):

    Rasmussen, T. P. and Girotra, S. 2021. A Contemporary Update on Targeted Temperature Management, Available at: https://www.acc.org/latest-in-cardiology/articles/2021/11/09/13/16/a-contemporary-update-on-targeted-temperature-management (Accessed 15/05/2022).

    Resuscitation Council, 2021. Post-Resuscitation Care Guidelines, Available at: https://www.resus.org.uk/library/2021-resuscitation-guidelines/post-resuscitation-care-guidelines (Accessed 15/05/2022).

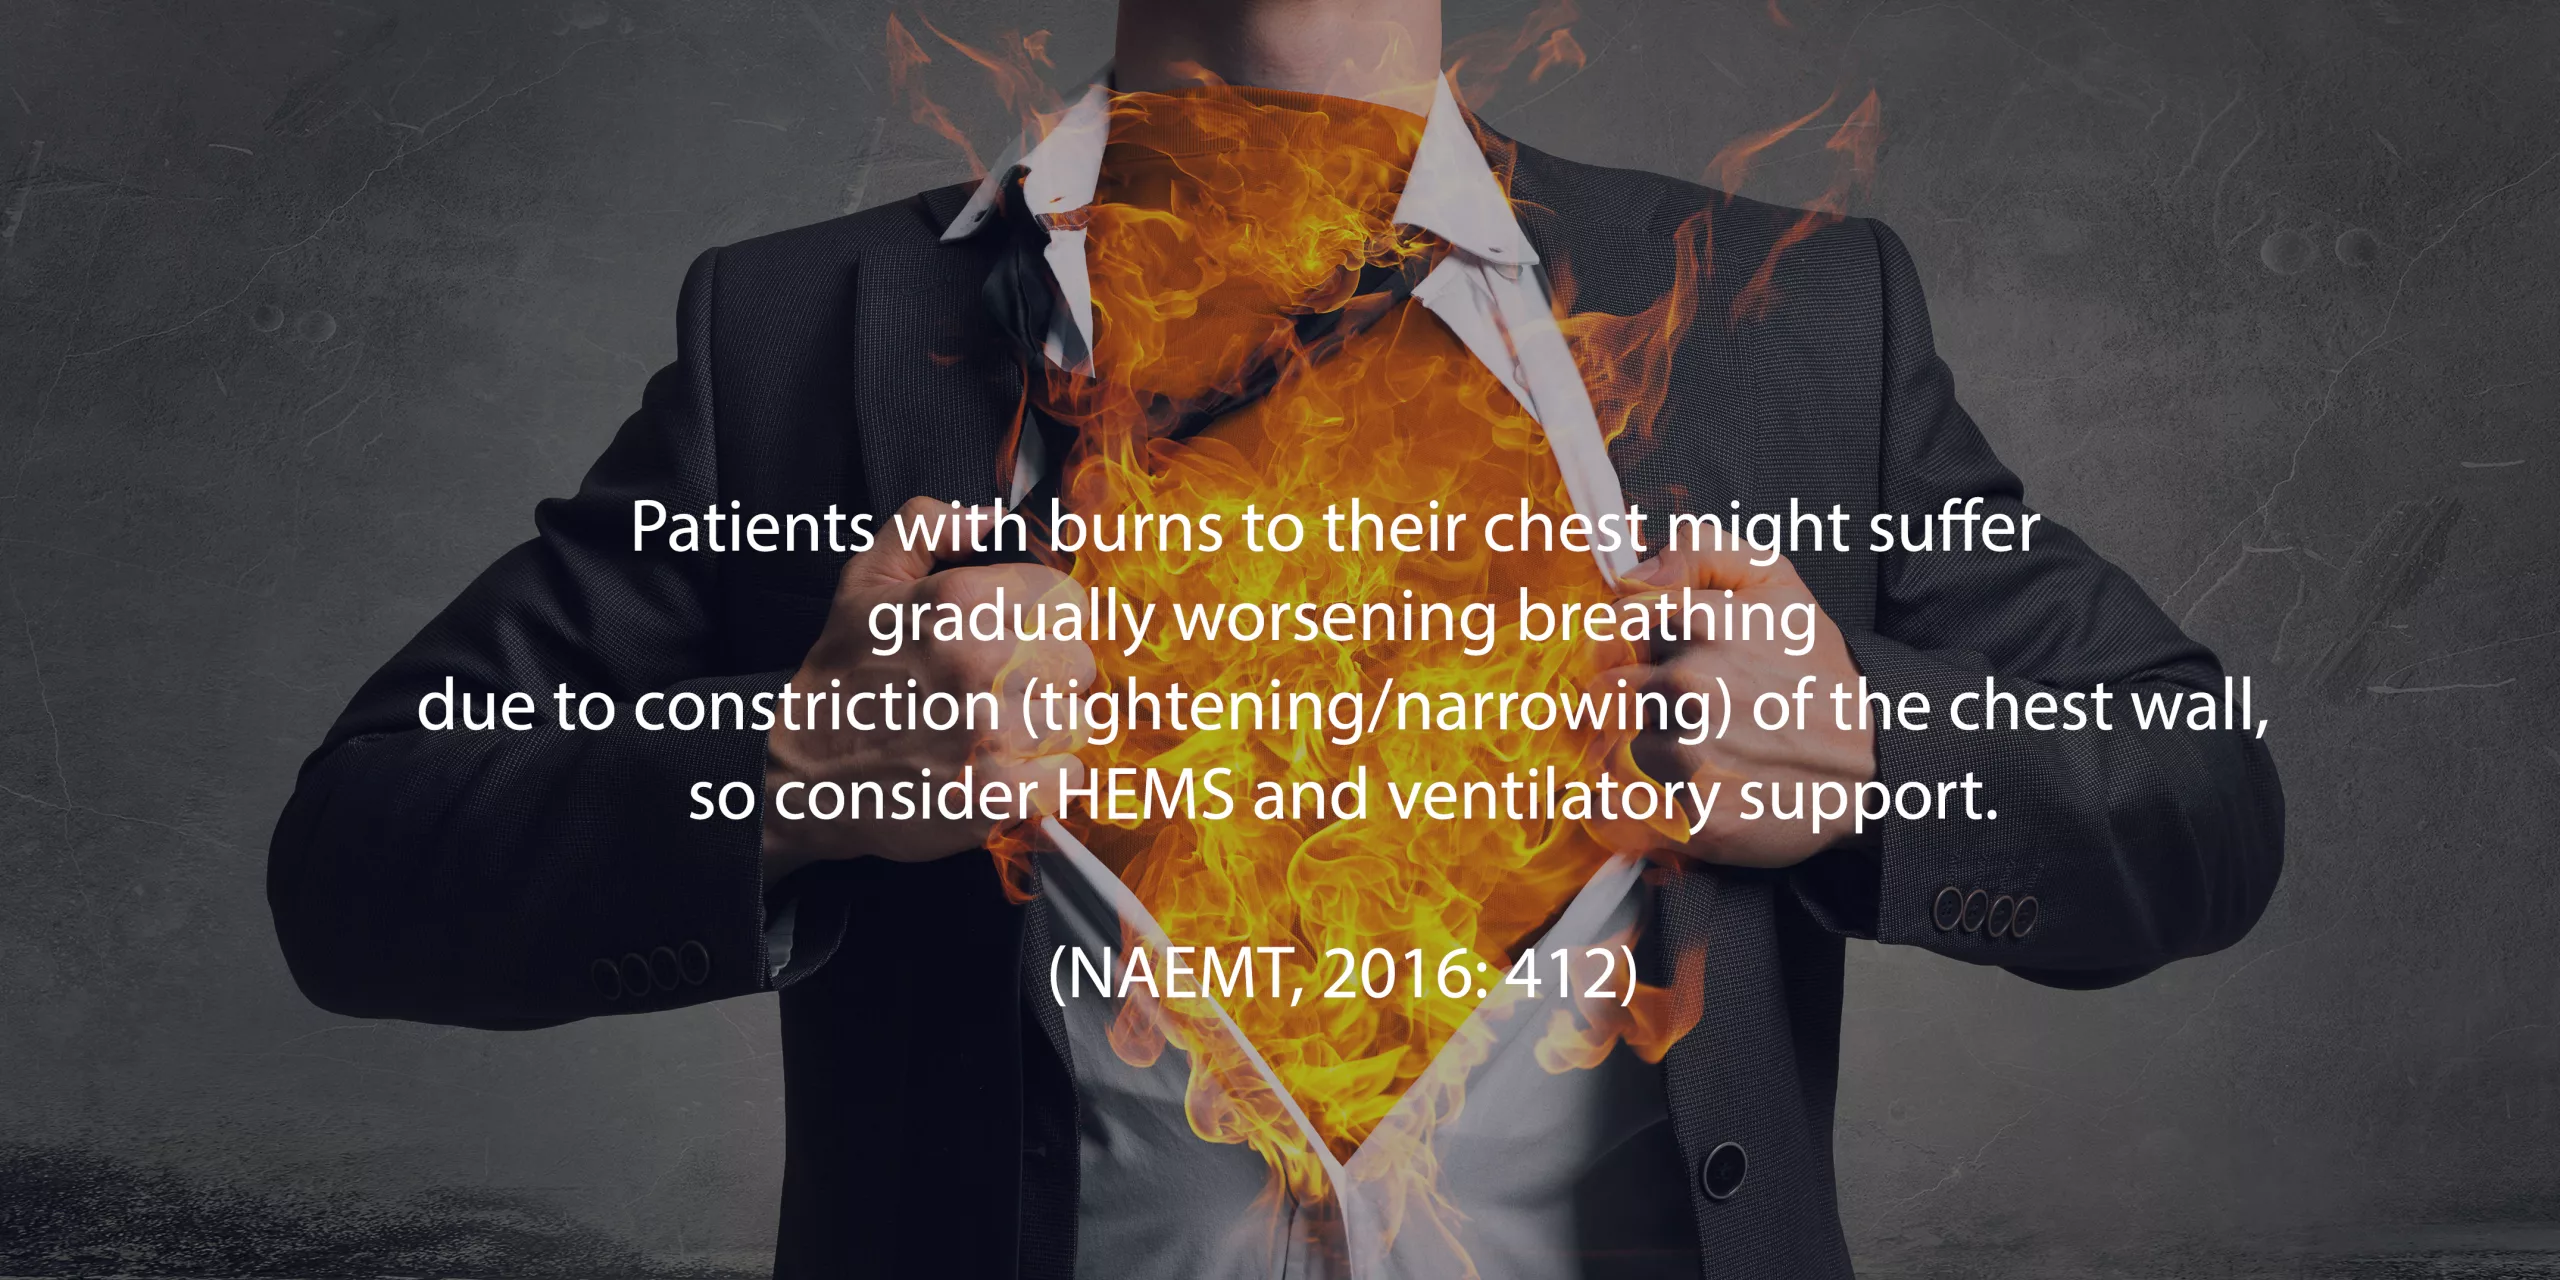
  • Patients with burns to their chest might suffer progressively worsening breathing

    Patients with burns to their chest might suffer progressively worsening breathing

    FAST FACT – This is based on the Burns: The Practical Stuff video and post.

    Full reference available in full post.