Category: Circulation

  • ECG Concepts: The Importance of Time and Direction

    ECG Concepts: The Importance of Time and Direction

    Often basic ECG teaching relies on teaching pattern recognition, which can work well, however when presented with an ECG that isn’t similar to a pattern you have seen, you can run in to problems.

    This article will explore two simple concepts that will hopefully help with your ECG reading and understanding of the underlying physiology:


    Looking for help with a key term? Jump to them here:

    Jump to references


    Time

    Let’s start with time. It seems simple enough.

    It can be good to think of an ECG as a graph with an X and Y axis. X, horizontally along the bottom represents time. We’ll come to the Y axis later.

    Now, we know that X is time, each small square is 40ms (0.04seconds), each large square is 200ms (0.2 seconds), 30 large squares is 6 seconds and so on. That’s reasonably straightforward, but how does it relate to physiology?

    Let’s imagine that graph again. And let’s imagine some boxes drawn on. Don’t worry about the Y axis value for now.
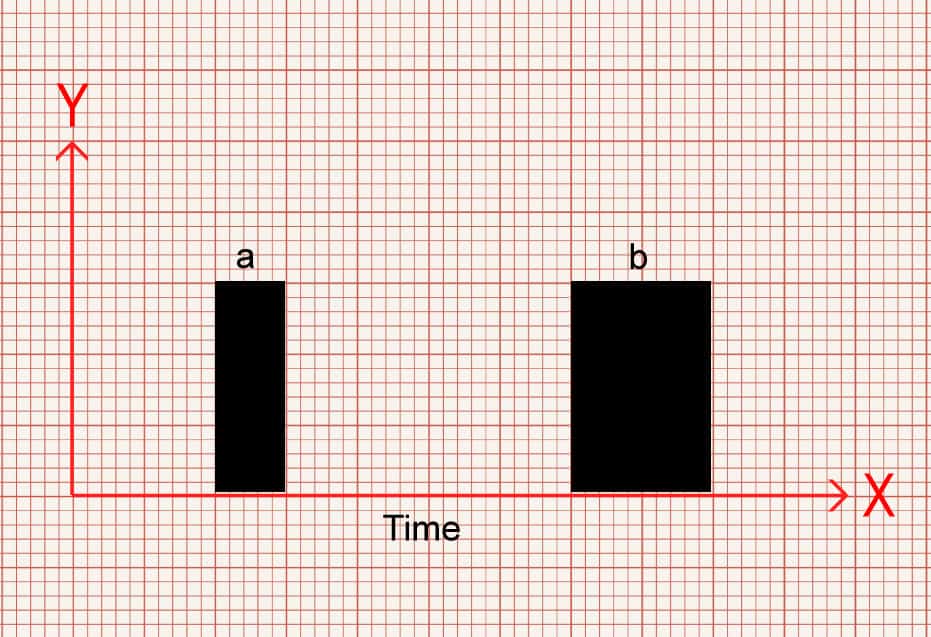
    In image 1 you can see a narrow box (a) and a wider box (b). Which one would you say takes up more time? Which one takes up less time?

    Box b takes up more of space along the X axis so therefore takes up more time. Box a covers less space on the X axis so takes less time.

    Similarly, we can measure between two points. Look at Image 2. You can see two horizontal lines of different lengths. The gap between a – b  is shorter than c -d. So again, which takes up more time?
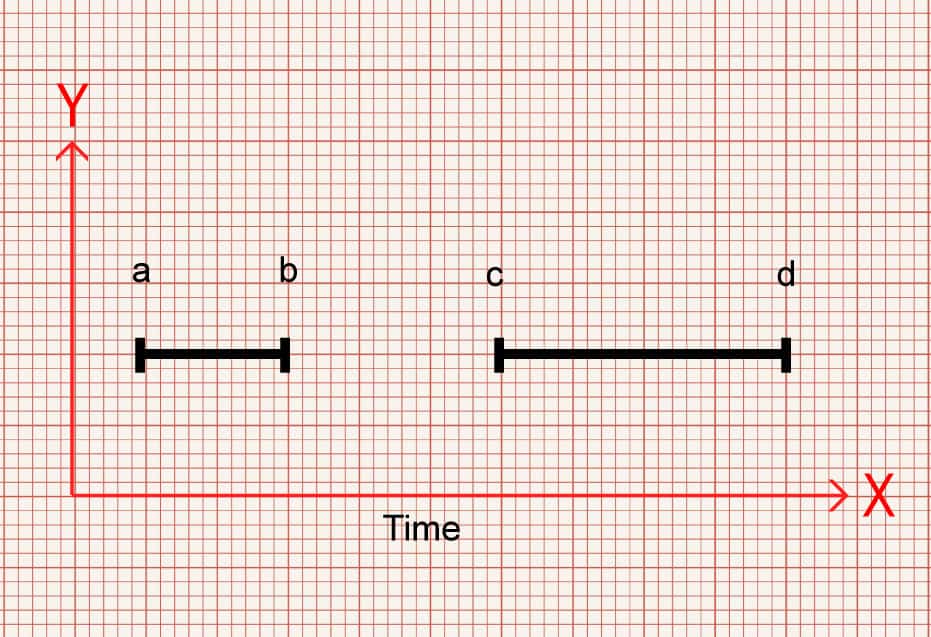
    Gap c-d is wider, takes up more of the X axis and therefore takes up more time.

    Stay with me.

    Now, let’s replace those boxes with QRS complexes.

    In image 3 there is a narrow QRS (a) and a wider QRS (b). Which one takes up more time?
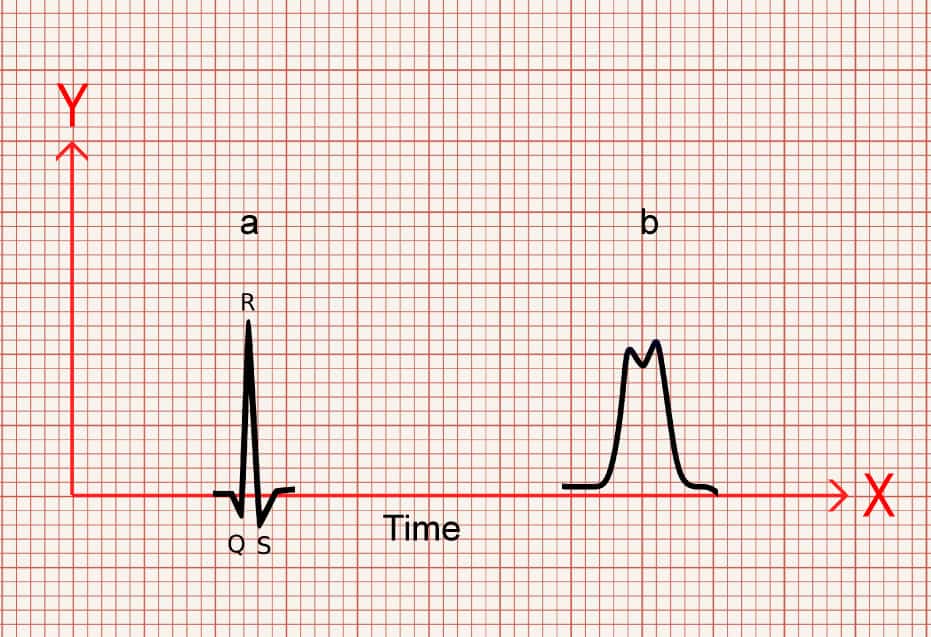
    B is taking up more of the X axis so takes more time.

    And again, once more, let’s look at some gaps between two points, but let’s show it as the gap between the P wave and QRS. Which one takes up more time and which takes up less time?
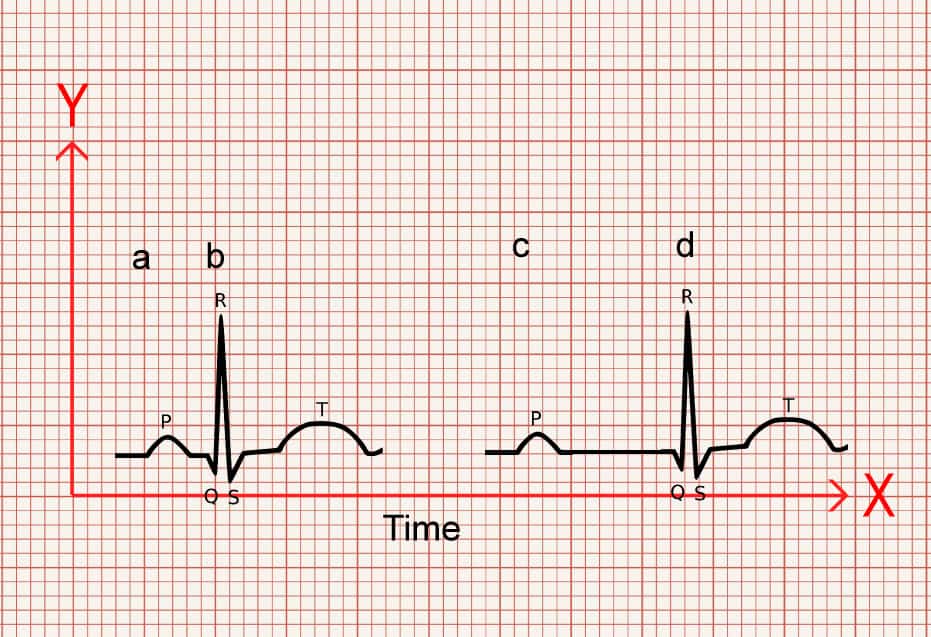
    The gap between a-b is shorter than c-d.

    So c-d takes up more time.

    Probably not ground breaking.

    But, what’s another way of thinking about the time something takes? If something takes up more time, you could also say that it is slower, and if something takes up less time, its faster.

    Now, remember that an ECG is dealing with electrical conduction.

    If on an ECG something is taking up more space along the X axis, therefore taking more time, and is therefore slower, then it makes sense that there is a problem effecting its ability to conduct!

    And poor conduction is the underlying issue that what we see in AV blocks and bundle branch blocks.

    So if you see a QRS or PR that is wider than normal values, think, something is causing it to be slower and that there is a conduction fault.

    Equally if you see a PR interval that is narrower than it is meant to be, taking up less space along the x axis and therefore less time, think, it’s conducting faster than it should and it would alert you to pre-excitation problems, such as accessory pathways in Wolff-Parkinson-White syndrome (WPW effects both the PR interval making it shorter, and has a wider QRS).

    Direction

    Now, let’s talk about direction.

    We know by looking at the ECG paper that vertically, the small boxes, measured in mm, represent millivolts (mV) – a measure of force (sort of). Each 1mm = 0.1mV, 10mm = 1mV. This also means that it has what’s known as magnitude – or size.

    Now, let’s look at the graph again. We know the X axis is time, as discussed above. However, in an ECG the X axis is not simply the bottom, but instead the middle of the graph, with the Y axis extending both positively above the X, and negatively below the X axis.
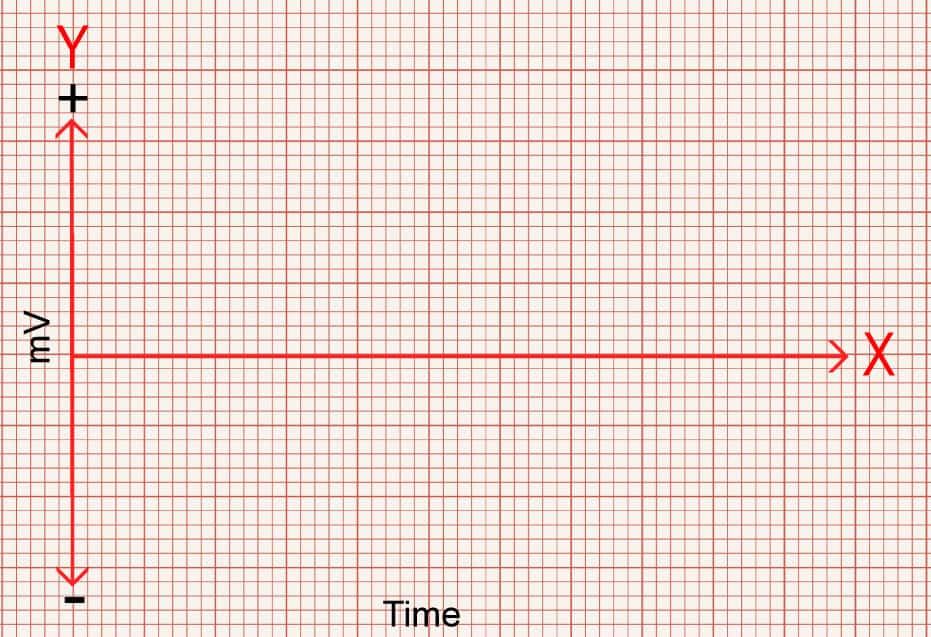
    The X axis can have readings above or below it. This is the isoelectric line.

    ECGs pick up electrical charge moving across the heart. And it does so by placing electrodes at different locations around the heart.

    As shown in the diagram below, the electrodes create a view of the heart from different angles, and each view is called a lead. 12 leads (views), but only 10 wires.

    The chest leads look at the heart across the transverse plane, that is from the front of the chest to the back, whereas the limb leads look at the heart in the frontal plane, which are essentially from the sides, top and bottom.

    The angles the leads look at the heart are measured in degrees, with lead i being the reference point of 0°.

    This is something that is worth learning so that you are able to visualise where each lead “looks”.  
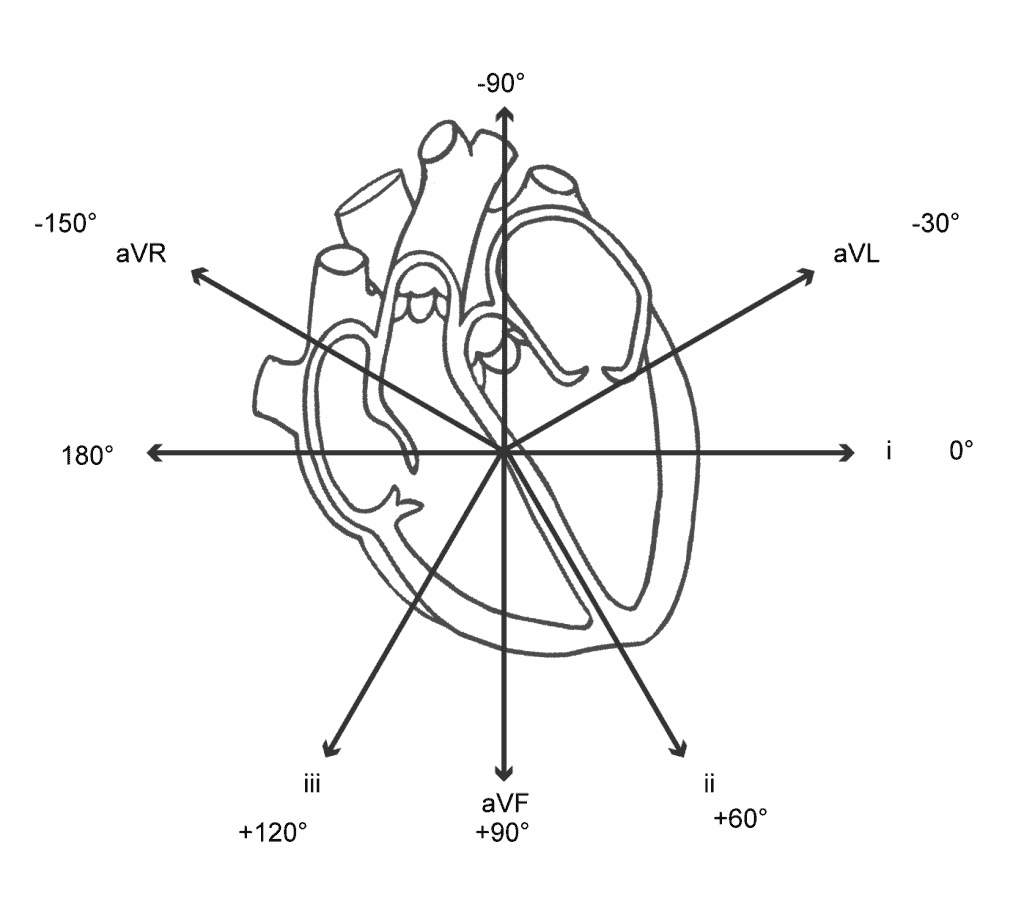
    Roughly speaking, the limbs leads create the following views of the heart.

    • avR – Looks from the Right shoulder to the left hip
    • aVL – Looks from Left shoulder to right hip
    • i – Looks from the left mid axilla similar to V6
    • ii – Looks from the left hip to right shoulder
    • aVF – Looks from the Feet up to the head
    • iii – Looks from the right hip to the left shoulder
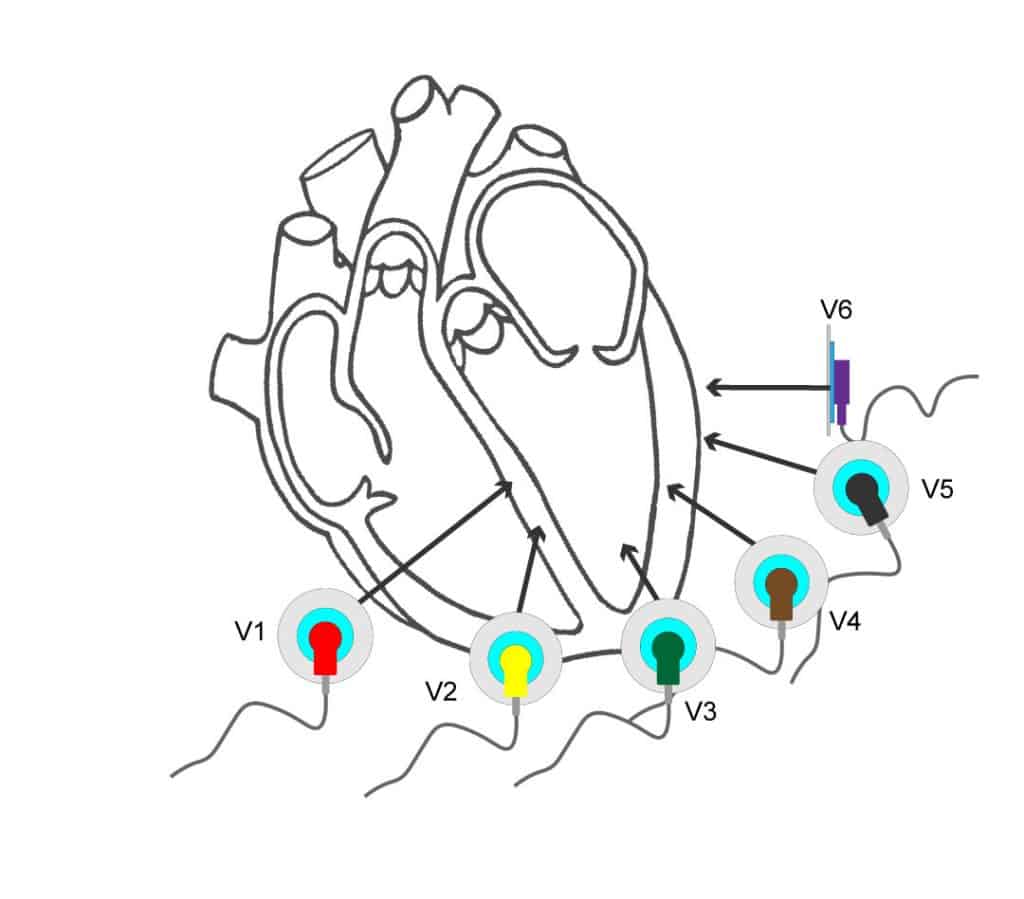
    The chest leads create views from the chest wall through to the back

    • V1 + V2 – intraventricular septum
    • V3 – V4 – anterior wall of the left ventricle
    • V5 – V6 – lateral wall of the left ventricle

    Very simply put, as an electrical charge moves towards an electrode position, this creates a positive reading. As it moves away it creates a negative reading.

    Electrodes that are opposite to each other, 180 degrees apart, will be mirrored. One will have charge moving towards it, creating a positive deflection and the opposite side will show a negative deflection as the charge moves away from it.
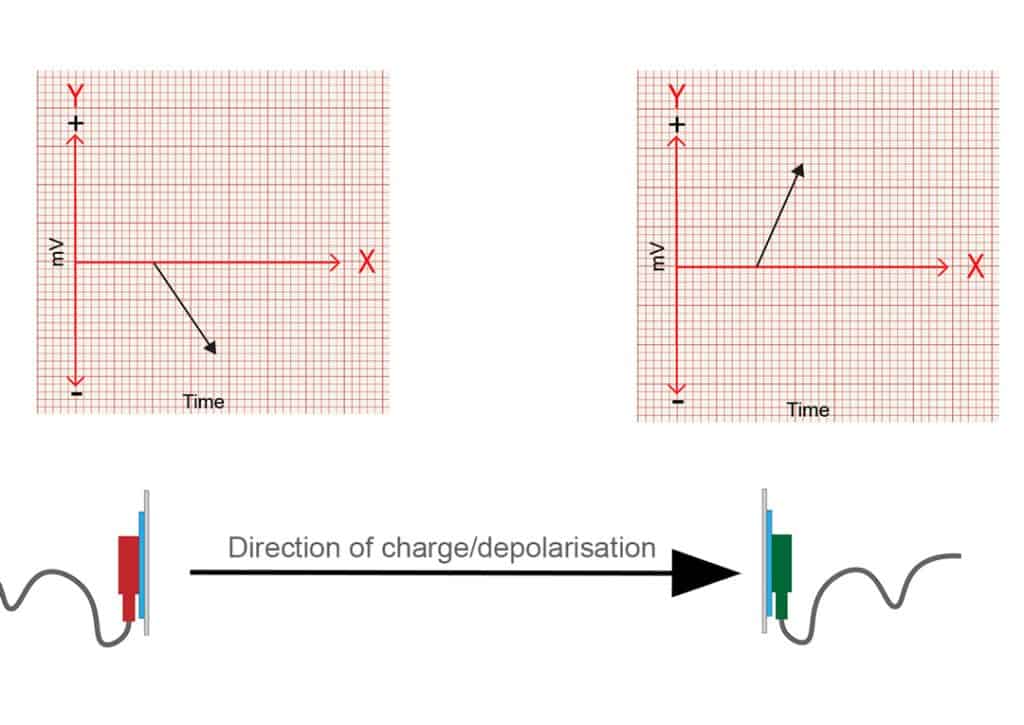
    Leads at 180° from each other.

    Slightly more complicated is what happens when the electrical charge isn’t moving directly to, or away from the electrode, but when it is moving at more or less than 180 degrees to the electrodes position.

    Let’s look at what happens when it moves at 90 degrees to the electrode first.
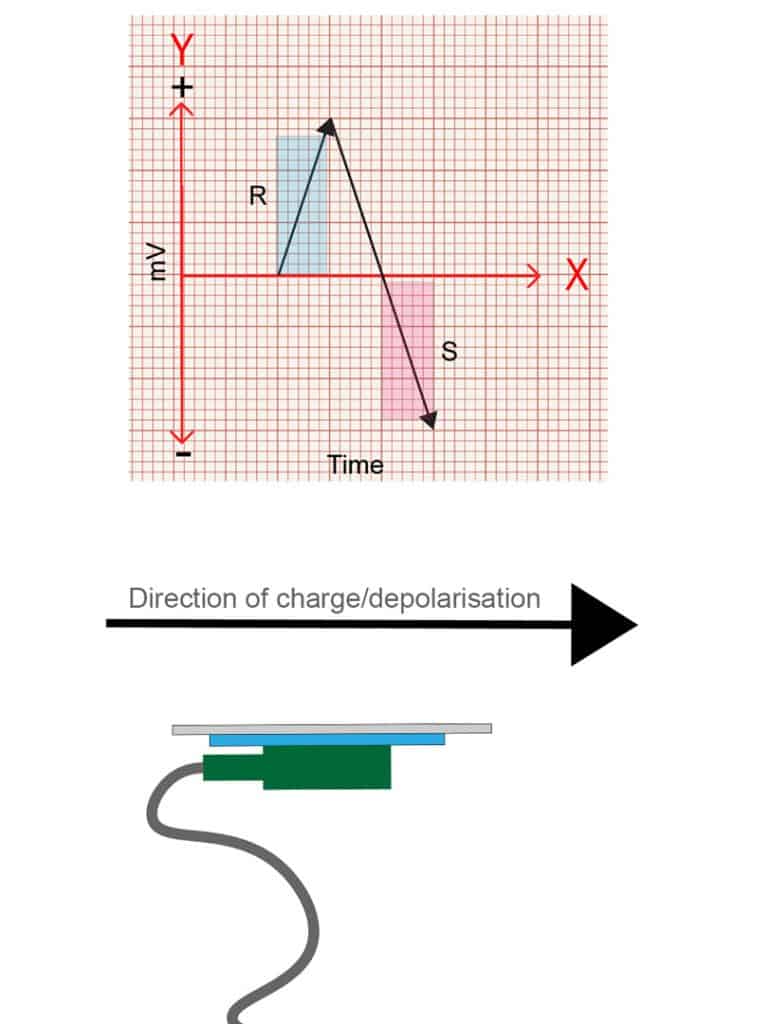
    When the charge is moving at 90 degrees, or perpendicular, to the position of the electrode, it  has both a period of positivity and a period of negativity, as the charge moves towards and then away from the electrodes position as it passes by. This is represented on an ECG as an R wave followed by an S wave of equal magnitude.

    Quick tip – an R wave is any positive deflection you see, and an S wave is a negative deflection following an R wave BUT it must cross the isoelectric line to be considered negative. The segment from the top of the R wave back to the isoelectric line is not the S wave. The S wave is only the portion below the isoelectric line.

    Hopefully this is starting show the relationship between the direction of the charge and the position of the electrode.

    So, what happens if the charge moves at 45 degrees to an electrode’s position? Well, it’s a bit more towards the electrode than 90 degrees, but not straight on. So the tracing will show a predominately positive wave, with a smaller S wave. The opposite will be true if travelling at say 135 degrees away from an electrode.
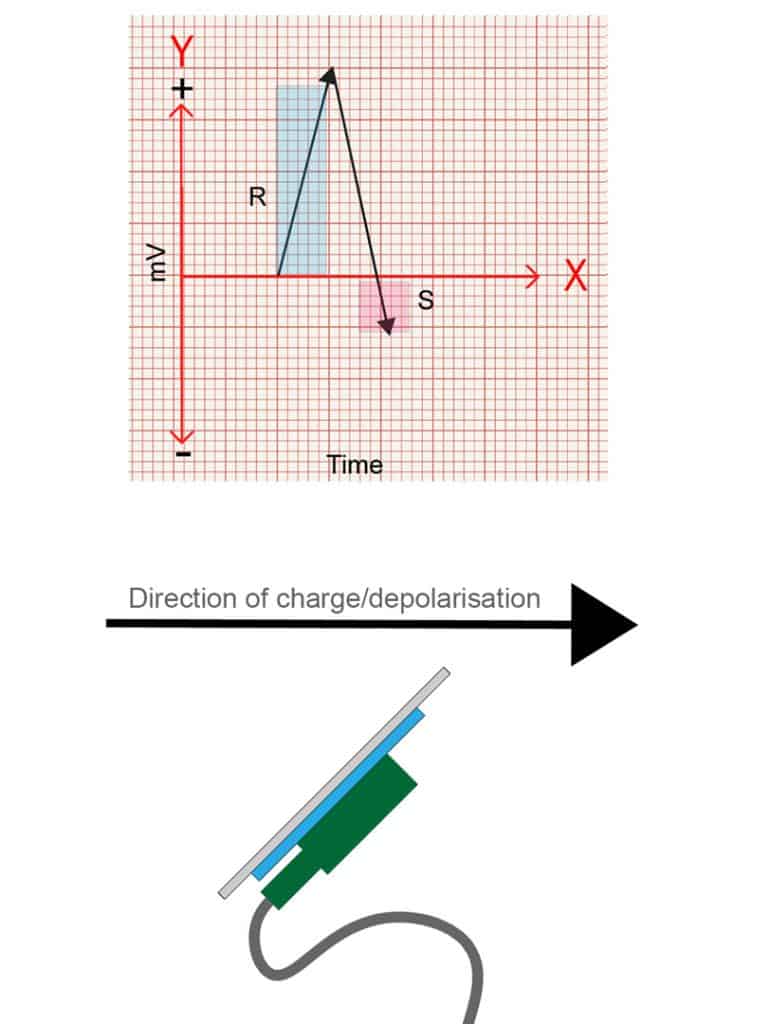
    Hopefully you can see then, that by varying the direction the charge travels, you’ll get different combinations of positive and negative deflections, and that it is relative to the position of each lead/view!

    This means that the waves on an ECG not only have a value in magnitude (mV), but also direction. This combination of magnitude and direction is known as a vector.

    So not only can the ECG waves tell you the charge in volts, but it can also show you the direction that charge is moving relative to the electrode placement.

    Why is this important?

    Well, many of the pathologies we come across effect the direction the charge moves across the heart.

    For example, in left bundle branch block (LBBB), the left conduction pathway is faulty. This means all of the electrical charge must come from the right side of the heart, and travels across the heart from right to left through the slower conducting muscle tissue.
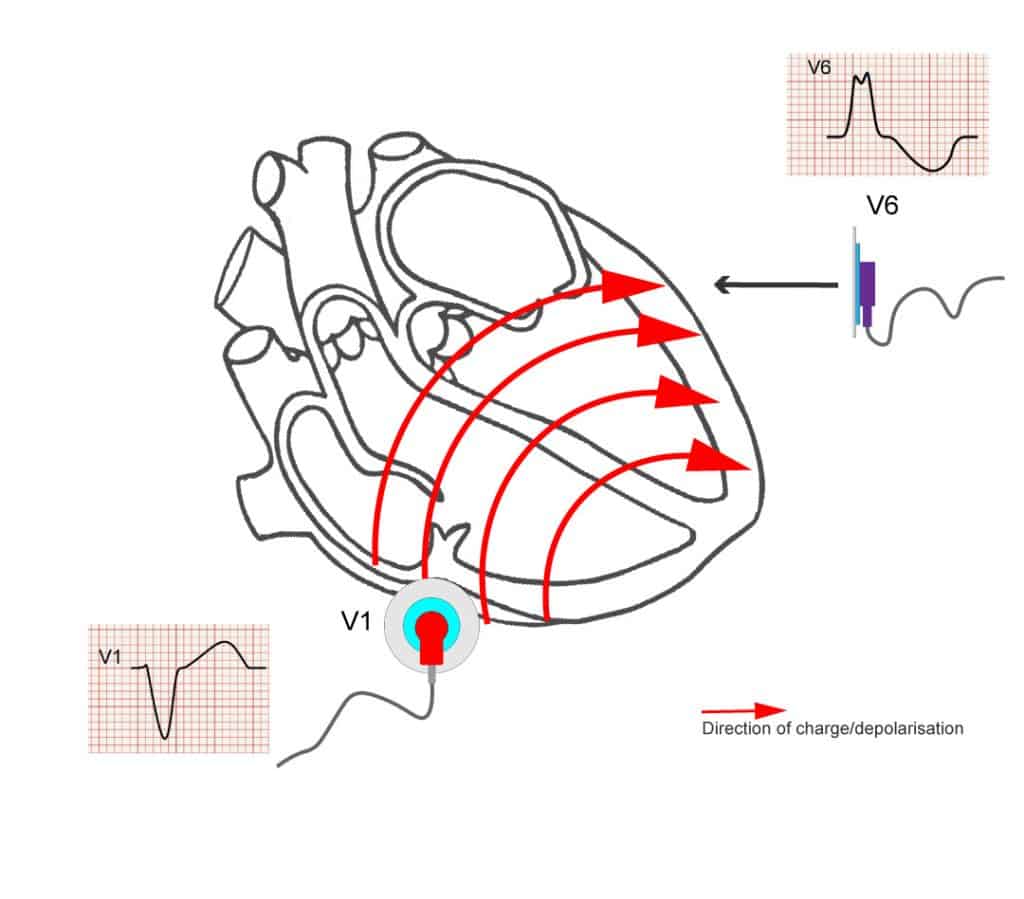
    V1 looks at the right side of the heart, so, with right to left movement, the charge is moving , slowly, away from V1, giving the classic negative, deep S wave seen in LBBB.

    Understanding the concepts of vectors is important if you want to understand axis deviation, reciprocal changes in STEMIs, left anterior and left posterior fascicular blocks, T wave inversions and strain patterns, and how to identify bundle branch blocks.

    Final Notes

    So, to sum up, understanding how time is displayed on the ECG will lead to better recognition of conduction faults. Understanding that the ECG shows both direction and magnitude means you can easily understand how that charge is moving across the heart. Couple this with further reading around the physiology and pathophysiology and your ECG interpretation should greatly improve!

    Just as a final caveat: electrophysiology is complicated. This is a basic description of the principles and vectors, but the images are not exact examples. The detailed process of how the electrodes work, how the leads form their views, the physics behind it and so on are far beyond the scope of this article, but hopefully this has given some insight into the applied nature of ECG.

    References

    The above post is written by an Article999 contributor and contains a mix of original content and explanations based on the below sources. All images are combined from licensed Adobe Stock images and the author’s own work, as with all Article999 content.

    Cadogan, M. And Buttner, R. 2022. ECG Axis Interpretation. Available at: https://litfl.com/ecg-axis-interpretation/ (Accessed 19/01/2023).

    Cadogan, M. 2021. PR Interval. Available at: https://litfl.com/pr-interval-ecg-library/ (Accessed 19/01/2023).

    ECG Waves, n.d. Cardiac electrophysiology: action potential, automaticity and vectors. Available at: https://ecgwaves.com/topic/cardiac-electrophysiology-ecg-action-potential-automaticity-vector/ (Accessed 19/01/2023).

    ECG Waves, n.d. Left Bundle Branch Block (LBBB): ECG criteria, causes, management. Available at: https://ecgwaves.com/topic/left-bundle-branch-block-lbbb-ecg-criteria-treatment/ (Accessed 19/01/2023).

    ECG Waves, n.d. The ECG leads: electrodes, limb leads, chest (precordial) leads, 12-Lead ECG (EKG). Available at: https://ecgwaves.com/topic/ekg-ecg-leads-electrodes-systems-limb-chest-precordial/ (Accessed 19/01/2023).

    ECG Waves, n.d. The QRS Complex: ECG features of the Q-wave, R-wave, S-wave & duration. Available at: https://ecgwaves.com/ecg-qrs-complex-q-r-s-wave-duration-interval/ (Accessed 19/01/2023).

    Garcia, T. 2013. The Art of ECG Interpretation. 2nd ed. Jones and Bartlett Publications, Inc: Massachusetts.


  • Recommended Content: Cardiac Action Potential, Explained with Dominoes

    Recommended Content: Cardiac Action Potential, Explained with Dominoes

    If you, like me, struggle to understand the action potential, here is a great video from UBC Medicine, which explains the concept with dominoes. Check it out below.

    Credits: UBC Medicine
  • Interpreting the Acid-Base Balance Using Tic Tac Toe (0s and Xs)

    Interpreting the Acid-Base Balance Using Tic Tac Toe (0s and Xs)

    This information is taken from an excellent video by Radiometer, shown here:

    Put Simply:

    To interpret the acid-base blood gas results, you first need to know what normal levels are – and be careful, because there are international variations in what units we use, and you may also find slight variations in results. You also need to know what a high figure means vs a low figure – is this acidemia, or alkalemia? Let’s help you out:

    Your normal levels are:

    Ph = 7.35-7.45

    Pc02 = 4.7-6.0 kPa

    Hc03 = 22-26 mmol L

    Which way is acid, and which way is alkaline?

    You might notice that respiratory acidosis and respiratory alkalosis are in bold. That is to highlight the fact that these are opposite to the other parameters – a high pC02 = acidotic. A low pC02 – alkalosis. One simple way to remember this is to try to spell ‘opp’ (opposite) backwards, using the other parameters. To enable you to do this, you’re only allowed to swap one C for a P. Go ahead, try it.

    For pH, you obviously can’t do this.

    For HC03, you still can’t: Even if you change the C to a P, you still have an H in the way.

    For pc02, you can swap the C for a P and you can spell: 0PP backwards… That’s the parameter that is opposite to the others!

    How to Use Tic-Tac-Toe (0s and Xs)

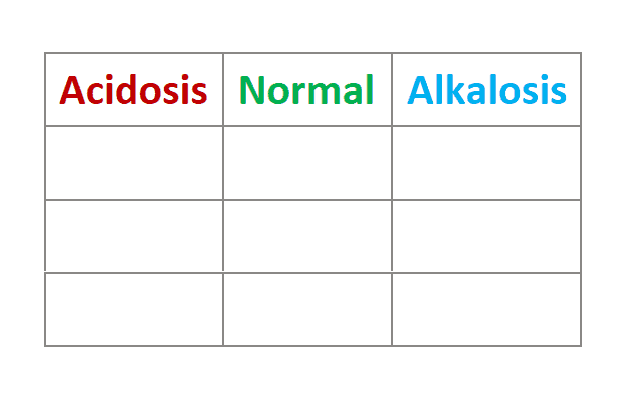
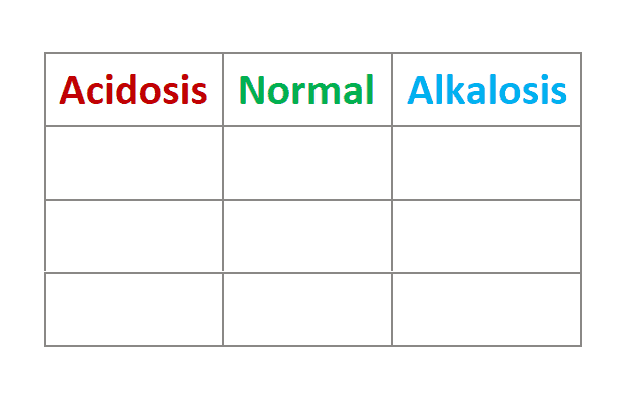
    First, draw a tic-tac-toe table like so.

    Next, put your pH into the acidosis, normal, or alkalosis column:

    AcidosisNormalAlkalosis
    pH 7.12  
      

    Next, put your HC03 or pC02 into the corresponding column. In this case, it’s the pC02:

    AcidosisNormalAlkalosis
    pH 7.12  
    pC02 13.9  

    It only takes 3 in a row for tic-tac-toe, and that includes the title, so you have an acidosis here. Because we are looking at the respiratory component (pC02), this is a respiratory acidosis.

    But we keep looking because we want to know if the body is trying to compensate. If it is, the opposite component – in this case, the metabolic component, HC03 – will be going in the opposite direction to the general trend. In this case, the general trend is respiratory acidosis, so we’re looking to see if the metabolic component is alkalotic. If there is no compensation, it will be in the normal range.

    AcidosisNormalAlkalosis
    pH 7.12  
    pC02 12  
      HC03 33

    And it’s above the reference range, so there is partial compensation here. But it’s only partial compensation because the pH isn’t normal.

    AcidosisNormalAlkalosis
     pH 7.36 
    pC02 11  
      HC03 33

    This is now fully compensated. We know it was probably respiratory acidosis before because a) we have the luxury of repeat blood gas results, and b) the pH is only just normal; in fact, it’s heading towards acidosis. We need to keep monitoring to see if this continues to normalise or if it heads in the wrong direction.

    You can use tic-tac-toe to identify respiratory or metabolic alkalosis or acidosis, mixed alkaloses/acidoses, and partial and full compensation. Don’t forget to look at other parameters as well though – more on those soon.

    References

    For this post, the video above, and:

    Thompson, D. A. 2007. Blood Gases Made Simple, Easy, and Quick. Lulu Press.

  • An Easy Way to Remember How to Identify Left and Right Bundle Branch Blocks

    An Easy Way to Remember How to Identify Left and Right Bundle Branch Blocks

    Dubin, 2000, pp: 191-198

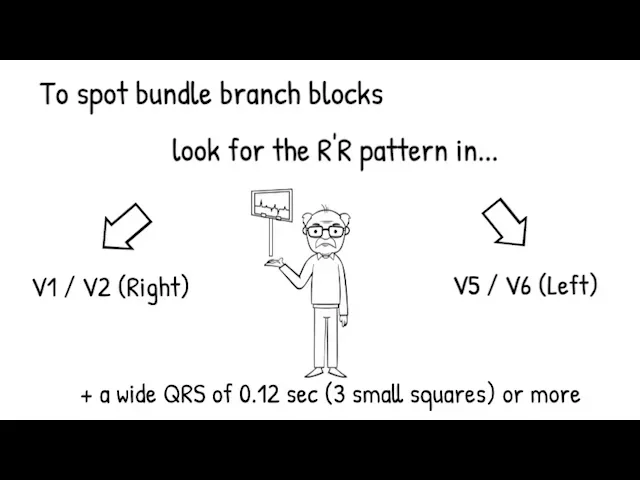
    Easily remembered as: In English we read from left to right, but the ECG prints a view of the heart from right (V1-V2) to left (V5-V6).

    Reference

    Dubin, D. (2000) Rapid Interpretation of EKG’s. 6th edition. Florida: COVER Publishing Company.


    Like it? Hate it? Spot a mistake? Let me know in the comments below ->

  • PARAMEDIC-2 Trial Results

    PARAMEDIC-2 Trial Results


    ‘For more than 50 years, treatment strategies have included the use of various drugs, but there is limited evidence that such treatments are effective’ (Perkins et al, 2018).

    Now the PARAMEDIC-2 trial results are in…

    • 8014 patients of the 10, 623 initially selected were included in the trial.
    • Of these, 4015 were given adrenaline and 3999 a placebo.
    • Of those who were given adrenaline and survived until discharge, 39 (31.0%) out of 126 patients had a ‘severe neurological impairment’ and of those who were given the placebo, the same was true for ’16 of 90 patients [17.8%]’
      (Perkins et al, 2018).

    Exclusions to the trial

    • ‘…those with anaphylaxis, pregnant women and children’ (below age 16).
    • After the pilot, life-threatening asthma as a suspected cause of the cardiac arrest was added as an exclusion because of ‘the potential overlap between the presentation of asthma and anaphylaxis’.
    • Anaphylaxis was excluded because adrenaline is considered potentially ‘beneficial’ for this condition
      (Warwick Clinical Trials Unit, 2018).

    The trial only looked at the effects of the use of adrenaline during out-of-hospital cardiac arrest and not at the use of adrenaline during ROSC, which is a protocol that some Trusts follow (Warwick Clinical Trials Unit, 2018). In addition, this does not cover any treatment initiated by the hospital if the patient was transported there.

    Conclusions

    ‘the benefits of epinephrine that were identified in our trial are small, since they would result in 1 extra survivor for every 112 patients treated. This number is less than the minimal clinically important difference that has been defined in previous studies.29,30 Among the survivors, almost twice the number in the epinephrine group as in the placebo group had severe neurologic impairment’ (Perkins et al, 2018).

    Limitations

    Perceived limitations include: ‘Information about the quality of CPR was limited to the first 5 minutes of cardiac arrest and involved fewer than 5% of the enrolled patients.’ (Perkins et al, 2018)

    Further limitations to consider could be:

    • time to CPR
    • patient’s co-morbitities that weren’t already considered in the study

    More information

    Warwick’s Clinical Trials Unit have produced an infographic with more information here.

    View the University of Warwick’s press release here.

    References

    NIHR, 2018. Investigating the role of adrenaline in cardiac arrest. Available Online: https://www.nihr.ac.uk/news/investigating-the-role-of-adrenaline-in-cardiac-arrest/8931 (Accessed 19/07/18)

    Perkins, G.D. et al, 2018. A randomized trial of epinephrine in out-of-hospital cardiac arrest. New England Journal of Medicine. doi: 10.1056/NEJMoa1806842

    Warwick Clinical Trials Unit, 2018. Available Online: https://warwick.ac.uk/fac/med/research/ctu/trials/critical/paramedic2/faqs/ (Accessed 19/07/18)


  • Considering the Differential Diagnoses of Chest Pain? Consider This.

    Considering the Differential Diagnoses of Chest Pain? Consider This.

    Guest Post, by Paul Burgess of Athletic Nutrition.

    There is a common misconception that if someone experiences heart burn it is because they have too much stomach acid that is passing up the lower esophageal sphincter (LES). The LES is the valve which, in a healthy person, prevents this from happening. Interestingly, many patients presenting with heart burn actually have LOW stomach acid, which results in the same symptoms.


    [tabby title=”Super Summary”]

    • Low stomach acid is more likely to be the cause of heartburn
    • Bloating and food intolerances may be heightened by low stomach acid
    • Anti acid medications can make the problem worse
    • Getting into a decent sleep pattern can make all the difference.

    [tabby title=”Anatomy in Images”]

    The Stomach’s location

    The stomach in relation to other organs

    [tabby title=”What causes low stomach acid?”]

    Low stomach acid is the result of many factors that come into play at the same time. These factors, or causes are common in our modern day lifestyle, far more common than the causes of potentially high stomach acid. Their prevalence means that in the majority of cases you can be pretty sure that the cause of heart burn is not high but low stomach acid.

    Attributing causes are:
    • Poor sleep
    • Under eating (e.g on a diet)
    • Stress
    • Too much exercise in a calorie deprived state
    • Over use of antibiotics
    • Regular use of NSAIDs
    • H Pylori
    • Eating too quickly
    • Small intestinal bacteria overgrowth
    • Yeast infections
    • Food sensitivities
    • Age
    • Alcohol

    Now if you look through the list above you probably know a few people (if not many) who fit into at least 3 or 4 of those categories. If nothing else most people are sleep deprived and even if they do actually get to bed, the quality of their sleep is poor and broken. A high number of people have been on some kind of diet (which usually means calorie restriction) for many years. They are likely stressed and probably have a drink now and then.

    As you can see, it’s easy to live what is considered an apparently ‘normal’ lifestyle nowadays, a lifestyle that causes low stomach acid.


    [tabby title=”What is Stomach Acid & Why Is It Important?”]

    Stomach acid is also called hydrochloric acid due to its chemical structure of one hydrogen ion combined to one chlorine ion, making HCL. It is responsible for sterilizing any food that wishes to make it into your gut. It assists with killing off viruses, yeast, parasites and breaking down protein.

    Its most important role is the breakdown of protein in to its constituent amino acid parts, ready for absorption later in the digestive process.

    So, without adequate levels of stomach acid, there is a vicious cycle of poor digestion, chronic gut inflammation, microbial overgrowth, leaky gut, elevated stress hormones and lowered nutrient absorption. The only things that will break this loop are to reduce stress in all its forms and support adequate stomach acid production.

    [tabbyending]

    [tabby title=”So What’s Wrong With Omeprazole?”]

    This is the problem with mistaking low stomach acid symptoms for high stomach acid:

    The GP will recommend any one of a number of anti-acid medications such as Omeprazole, or the patient will self medicate with over the counter remedies such as Rennies or Gaviscon.

    If this is the case it will stop the feeling of heartburn BUT it will actually push the stomach acid down even further. Once this happens the health of the patient will decline over time due to even poorer absorption of nutrients, higher chances of bacterial infections and higher elevation of stress hormones.

    [tabby title=”So What’s the Answer?”]

    So what’s the answer?

    Its pretty simple really. The first thing to do is manage the lifestyle factors causing the issue in the first place. Better sleep, manage stress, less alcohol, etc.

    From a support point of view a good digestive enzyme that includes HCL with each meal would be all you really need to stop the pain immediately. For good measure, a 30 day course of probitiocs to improve the good bacteria in the gut would be a positive step.

    [tabby title=”Questions To Be Answered Soon”]

    Should we continue encouraging patients to try their own gaviscon in non-cardiac sounding chest pain as a one-off measure to see if it resolves the pain?

    If the gaviscon does resolve the pain, what does this tell us about the likely cause of the chest pain? (Remember, trop-t levels may still be necessary).

    Do acidic or alkaline foods affect the reflux much?

    [tabbyending]

    This was the first of Article 999’s Guest Posts, posts that have been written by other professionals. These posts, unlike the remainder of Article 999’s, are not referenced to academic sources as they are the expert opinion of the author. These posts are additions to the category of ‘nice to know’. Please remember to check your local guidelines and read our full disclaimer before putting into practice anything you see here.

    Comments? Questions? Let us know what you think by adding your comments below.

    This post is yet to be peer reviewed. Please get in touch if you have any comments.

  • What are the paramedic drugs and doses for adult ALS?

    What are the paramedic drugs and doses for adult ALS?


    Created using Visme. An easy-to-use Infographic Maker.

    Association of Ambulance Chief Executives (AACE), 2016. UK Ambulance Services Clinical Practice Guidelines 2016, Bridgwater: Class Professional Publishing