Category: EMT
-
Medics: Should We Delay Cord Clamping? How Long?
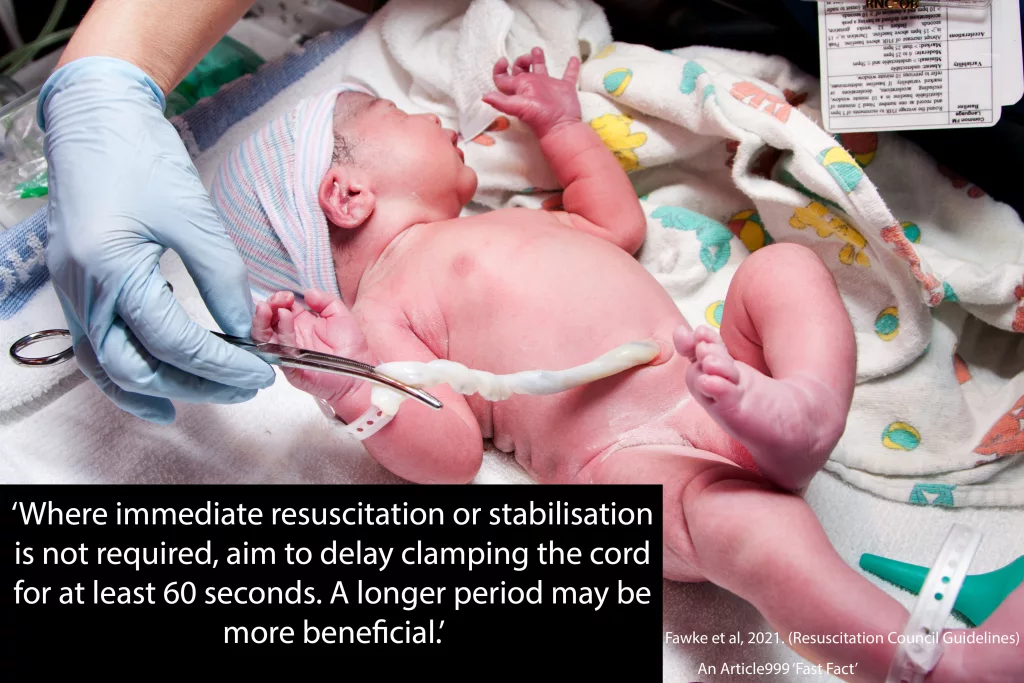
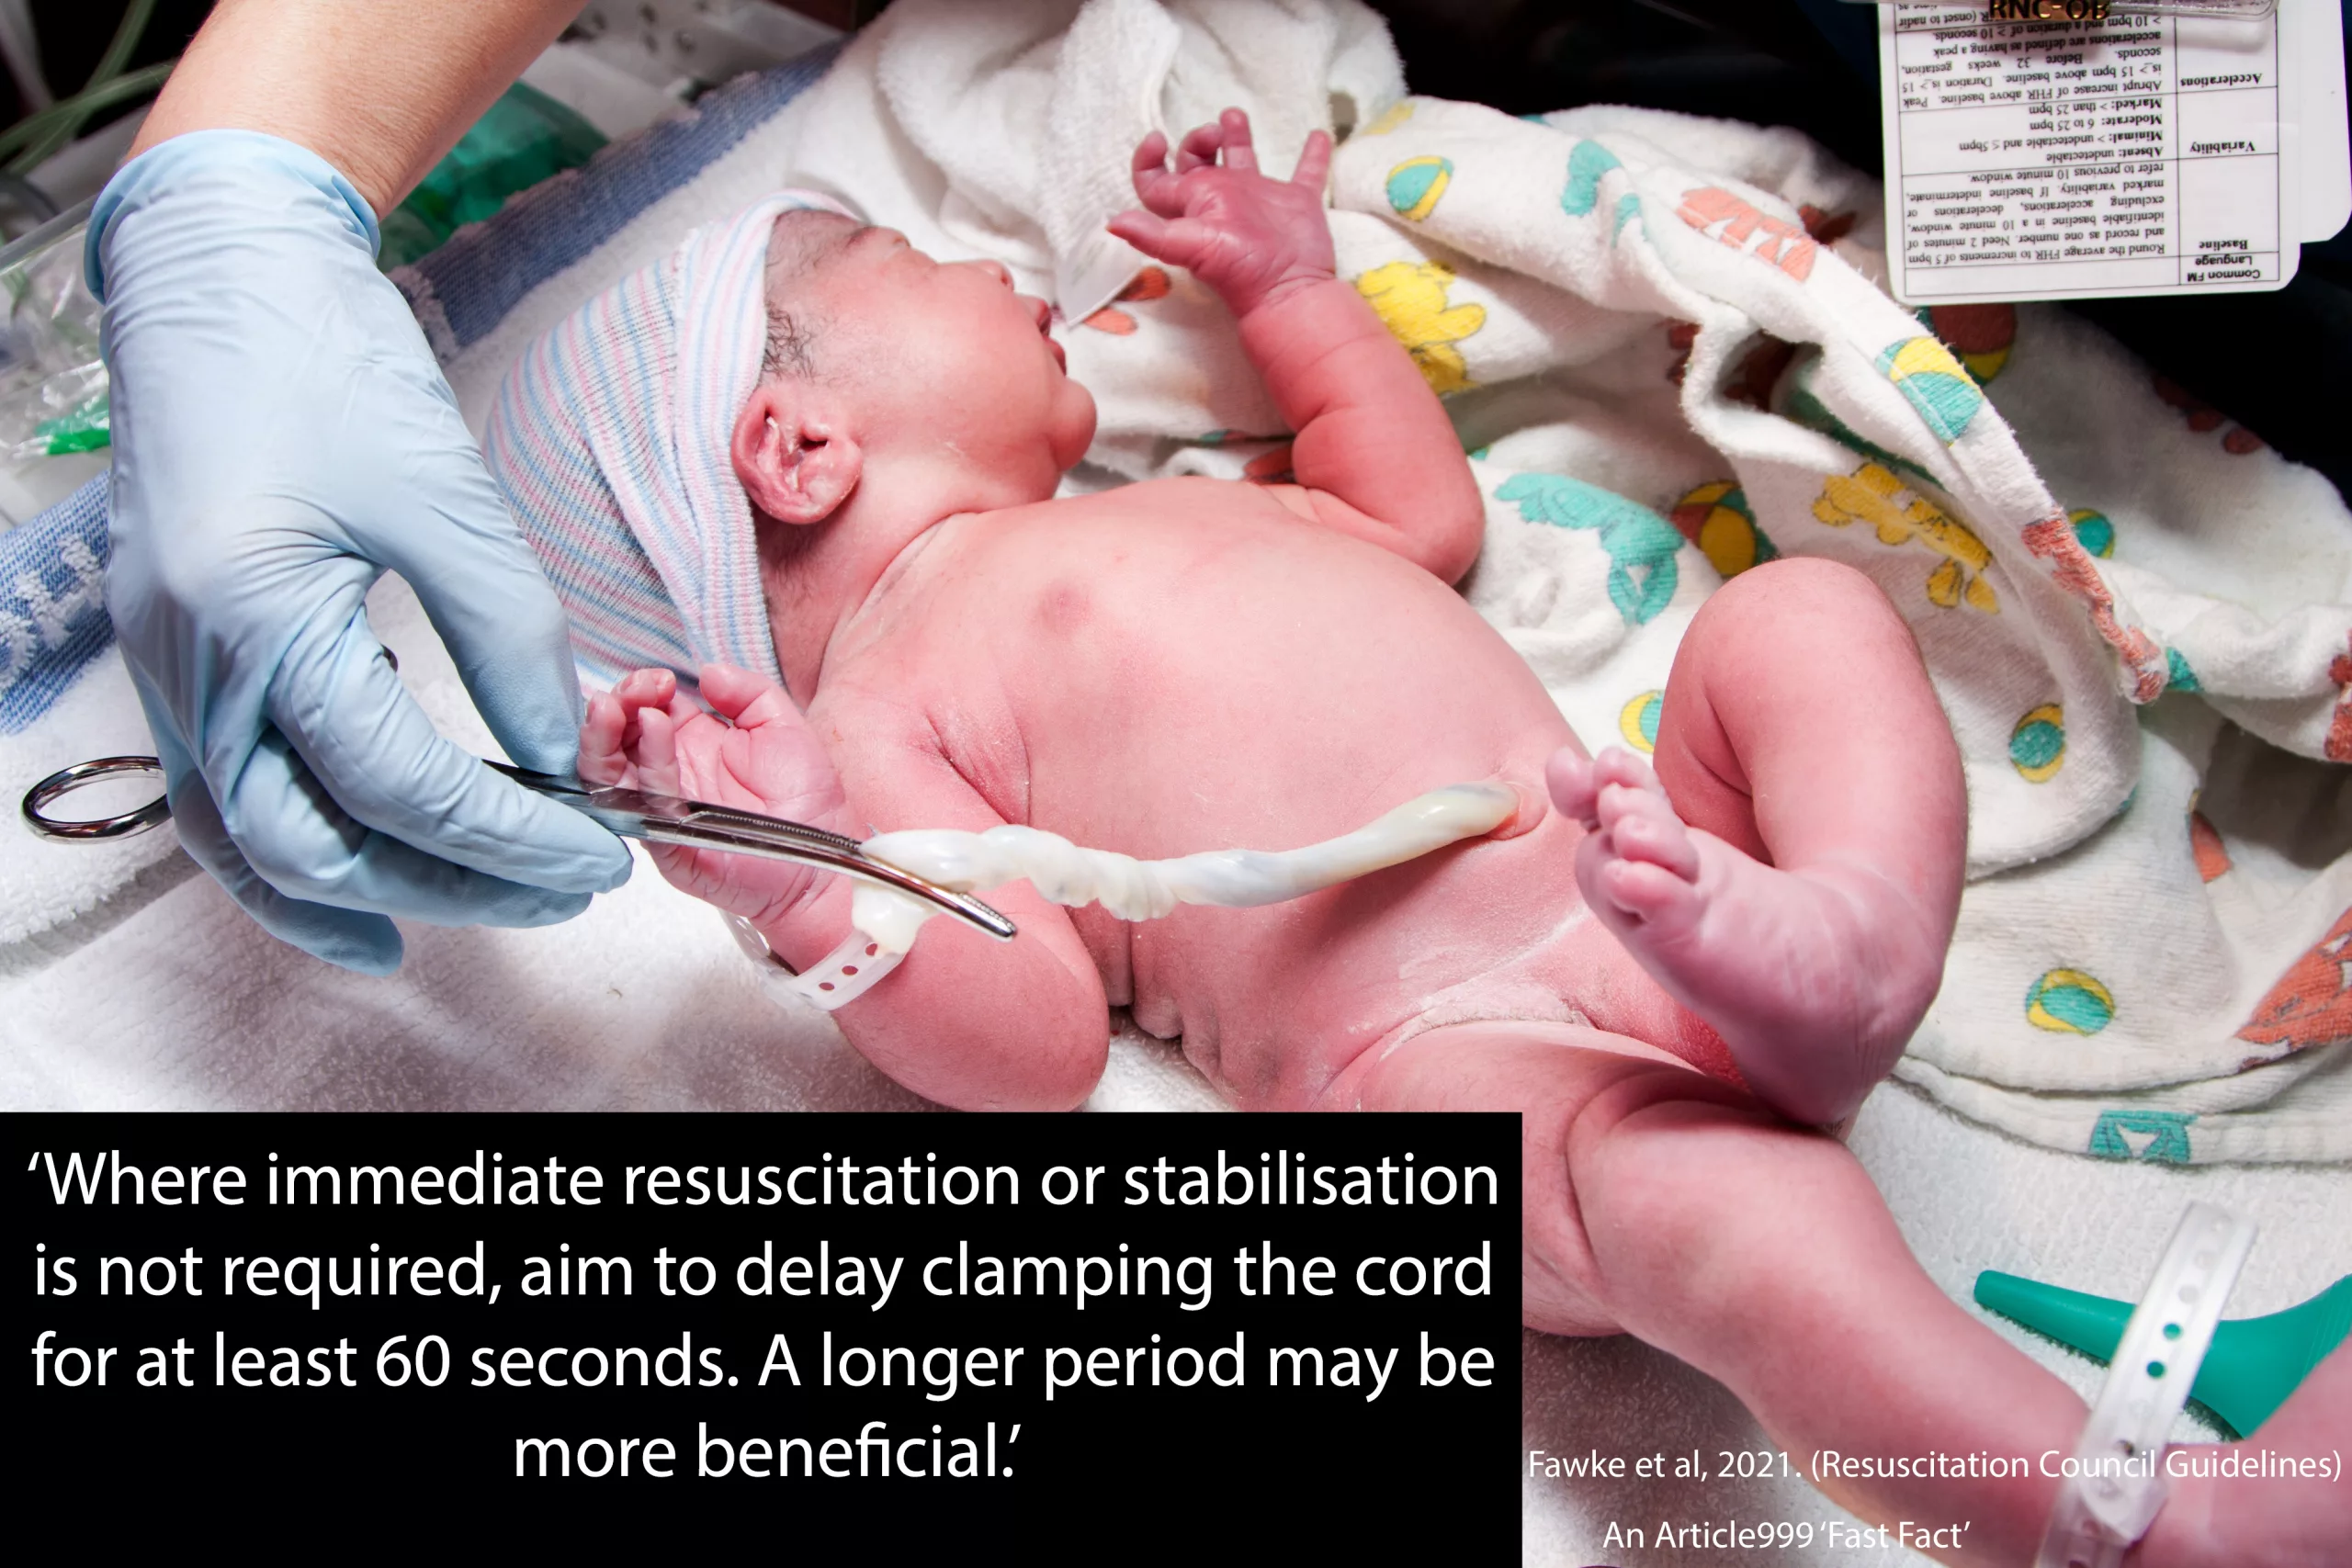
Photo containing quote from Resus Council about delayed cord clamping. -
The Decompensating Child: Blood Pressure Ranges to Watch
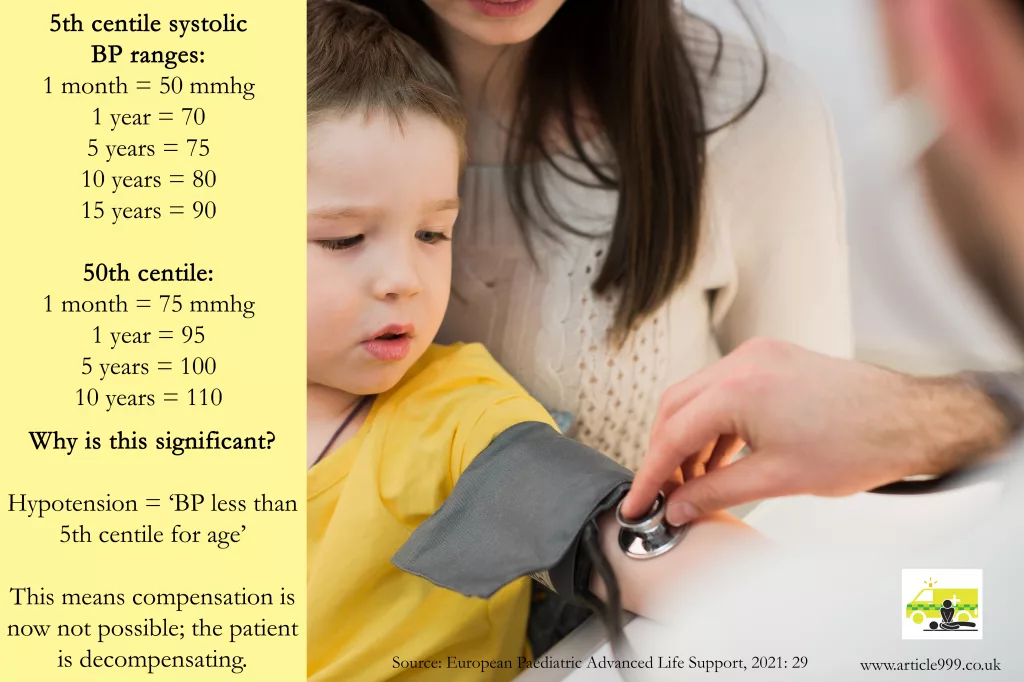
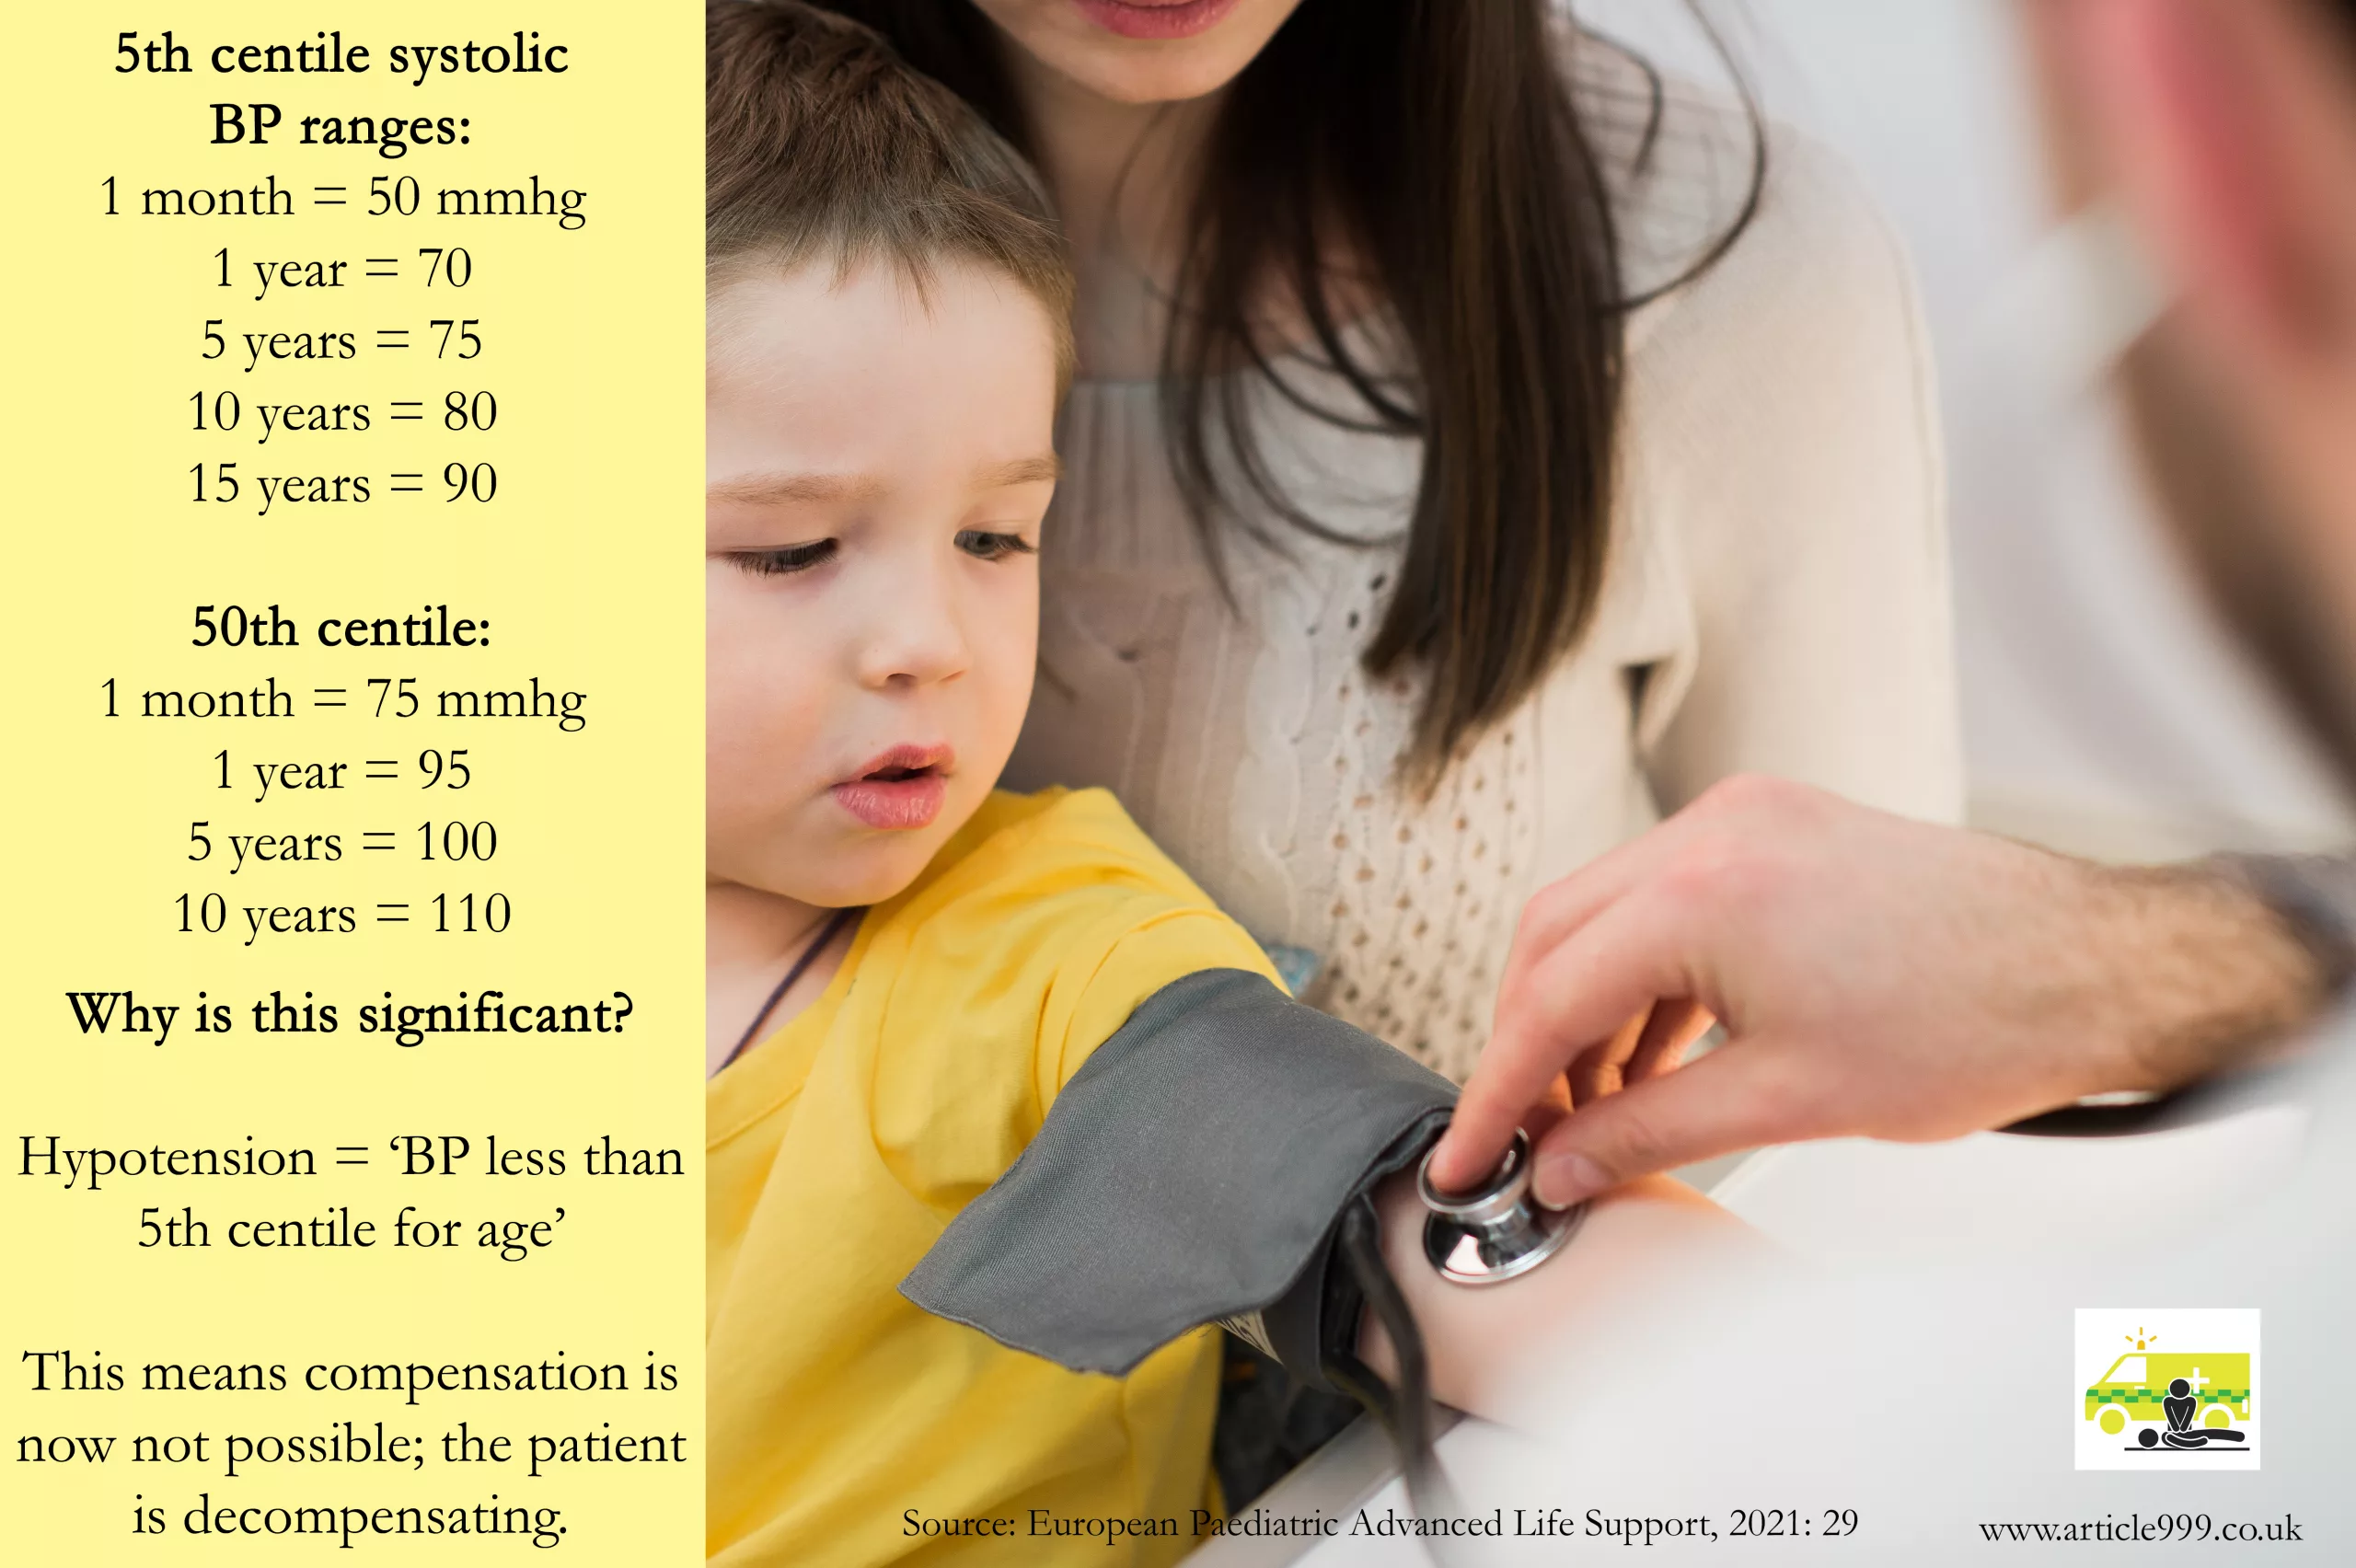
Image showing the 5th and 50th centile blood pressure ranges for children from 1 month-15 years. -

Lacerations – Criteria to Inform Referral Needs in Stable Patients
In your stable patients with lacerations, who do not have any urgent or troublesome A-D problems and who have not sustained injury through any great mechanism, what else should you be looking for in your assessment of their injury? What are the risk factors, according to different guidelines or authors?
While some of these elements may not be enough to refer a patient to secondary care on their own, they should help to increase your risk assessment during safe discharges. In combination, many of these factors should raise flags.
Depth Size Risk Factors Area There is limited evidence regarding the depth of wounds. The emphasis is on the structures that deep wounds would impact. For example, vascular damage, and nerve, tendon, or bony injuries (NICE, 2021). More than 5cm (NICE, 2021). Two or more of:
– Malaise
– Fever
– Rigors
– Contamination of site with body fluids, soil, faeces, or/and pus.
– Patient older than 65 years
– Diabetes
– Jagged wound edges
– Signs of tetanus
(NICE, 2021)Any of:
– Face
– Palm – and there is a potential infection.
– Joint with cellulitis.
(NICE, 2021).Contamination from unknown object (e.g. knife/glass) (NICE, 2021). Presence of necrotic tissue or slough, which could delay healing. Granulation tissue can also delay wound healing, but all can be prevented with appropriate dressings (Wilson, 2012: 11). Wounds older than 24 hours (Newman and Mahdy, 2021). Bites (Newman and Mahdy, 2021). Lacerations: A Collection of Risk Factors and Specific Criteria to Inform Referral Needs in Stable Patients. Have you found more, or would you like to add some from your own experience? Add these in the comments below, and let us know what you think about this post.
References
Newman, R.K. and Mahdy, H. (2021) ‘Laceration’, Treasure Island. Available at: https://www.ncbi.nlm.nih.gov/books/NBK545166/ (Accessed 18/11/2021)
NICE. (2021). Lacerations. Available at: https://cks.nice.org.uk/topics/lacerations/ (Accessed 18/11/2021).
Wilson, M. (2012) ‘Understanding the basics of wound assessment’. Wounds Essentials. 2. Pp. 8-12. Available at: https://www.wounds-uk.com/resources/details/wound-essentials-72-understanding-the-basics-of-wound-assessment (Accessed 28/12/2021).
-

Introducing Collaborative CPD
What is collaborative CPD? Well, it’s a way of tagging your crewmates/colleagues in specific CPD entries such as reflections on jobs, and then asking your crewmates/colleagues to answer some questions and provide some feedback on your communication and clinical management. You can then use this feedback as prompts to write – or expand – your reflective entries. Or you can export their feedback and add it to your portfolio as evidence of feedback. And your crewmates/colleagues can sync the shared CPD to their portfolios to evidence their own feedback or to prompt or expand on their own reflections. Watch the video for more:
-
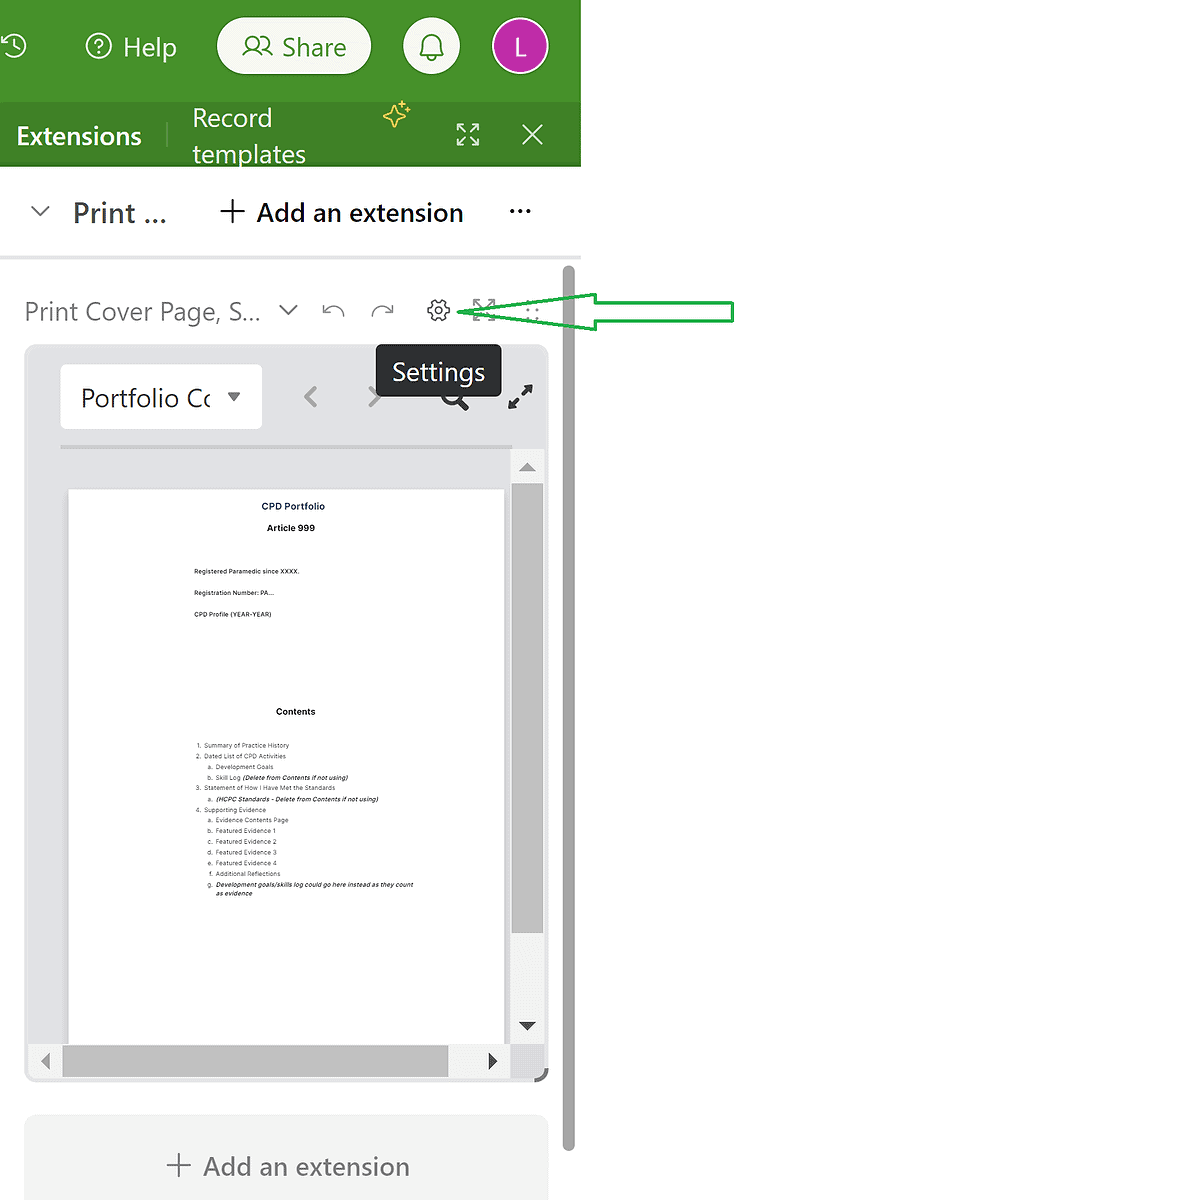
Video Guide/Walkthrough to Article 999’s CPD Templates, V1.6
Please note: These videos demonstrate printing/exporting the NQP portfolio. However, all portfolios (post-NQP/Non HCPC/NQP) print in the same way. There is simply more to print in the NQP version. Non NQPs can safely skip parts about printing the NQP learning outcomes.
Please also note: The settings in the templates are such to enable printing to work properly and to ensure your NQP learning outcomes are in the correct format. Please do not change the settings, unless I have specifically advised that you can. NQPs, please print your learning outcomes from the given table to ensure your portfolio is accepted. If you are unsure, please do reach out.
For more information, please see the CPD Templates main page, and the Help File.
The full walkthrough:
00:00 Intro
03:40 Logging CPD
12:50 Editing the Cover Page
14:00 Editing the Summary of Practice History (and checking the word count)
14:47 Adding more category/tag options for your CPD log – using the ‘check all fields’ tab (which is *not* for printing.
17:00 Adding/Editing Development Goals 19: 40 Editing the Statement of How I Have Met the Standards (and checking the word count)
20:10 Checking, and a second way of logging the NQP Learning Outcomes. Searching for met/not met outcomes as well. Use of the signature(s) column(s).
23:00 Checking, and a second way of logging HCPC Development Goals.
24:40 Printing/Exporting
How to print/export the:
25:10 Cover Page – Using the extensions tab
28:20 Summary of Practice History – Using the extensions tab
29:14 Dated List of CPD Activities – Checking the fields & word count before printing
32:09 Dated List of CPD Activities – Printing/Exporting the CPD Log
37:40 Evidence List 39:40 Reflections – Using the Extensions tab
41:25 Skills
42:00 Development Goals
43:00 Statement of How I Have Met the Standards
44:01 NQP Learning Outcomes
45:20 HCPC Standards of Proficiency
46:20 Merging the PDFs, Adding Page Numbers, Editing
52:06 NQPs or anyone wanting signatures – How to get your portfolio signed electronically.
54:00 Final bits of advice, references, and support options.The printing/exporting instructions only:
How to print/export the:
00:00 Cover Page
03:38 Summary of Practice History
04:38 Dated List of CPD Activities – Checking the fields & word count before printing
07:12 Dated List of CPD Activities – Printing/Exporting the CPD Log
12:45 Evidence List
15:00 Reflections
16:50 Skills
17:25 Development Goals
18:28 Statement of How I Have Met the Standards
19:39 NQP Learning Outcomes
20:45 HCPC Standards of Proficiency
22:30 Merging the PDFs, Adding Page Numbers, Editing
27:20 NQPs or anyone wanting signatures – How to get your portfolio signed electronically.
30:00 Final bits of advice, references, and how to seek support. -
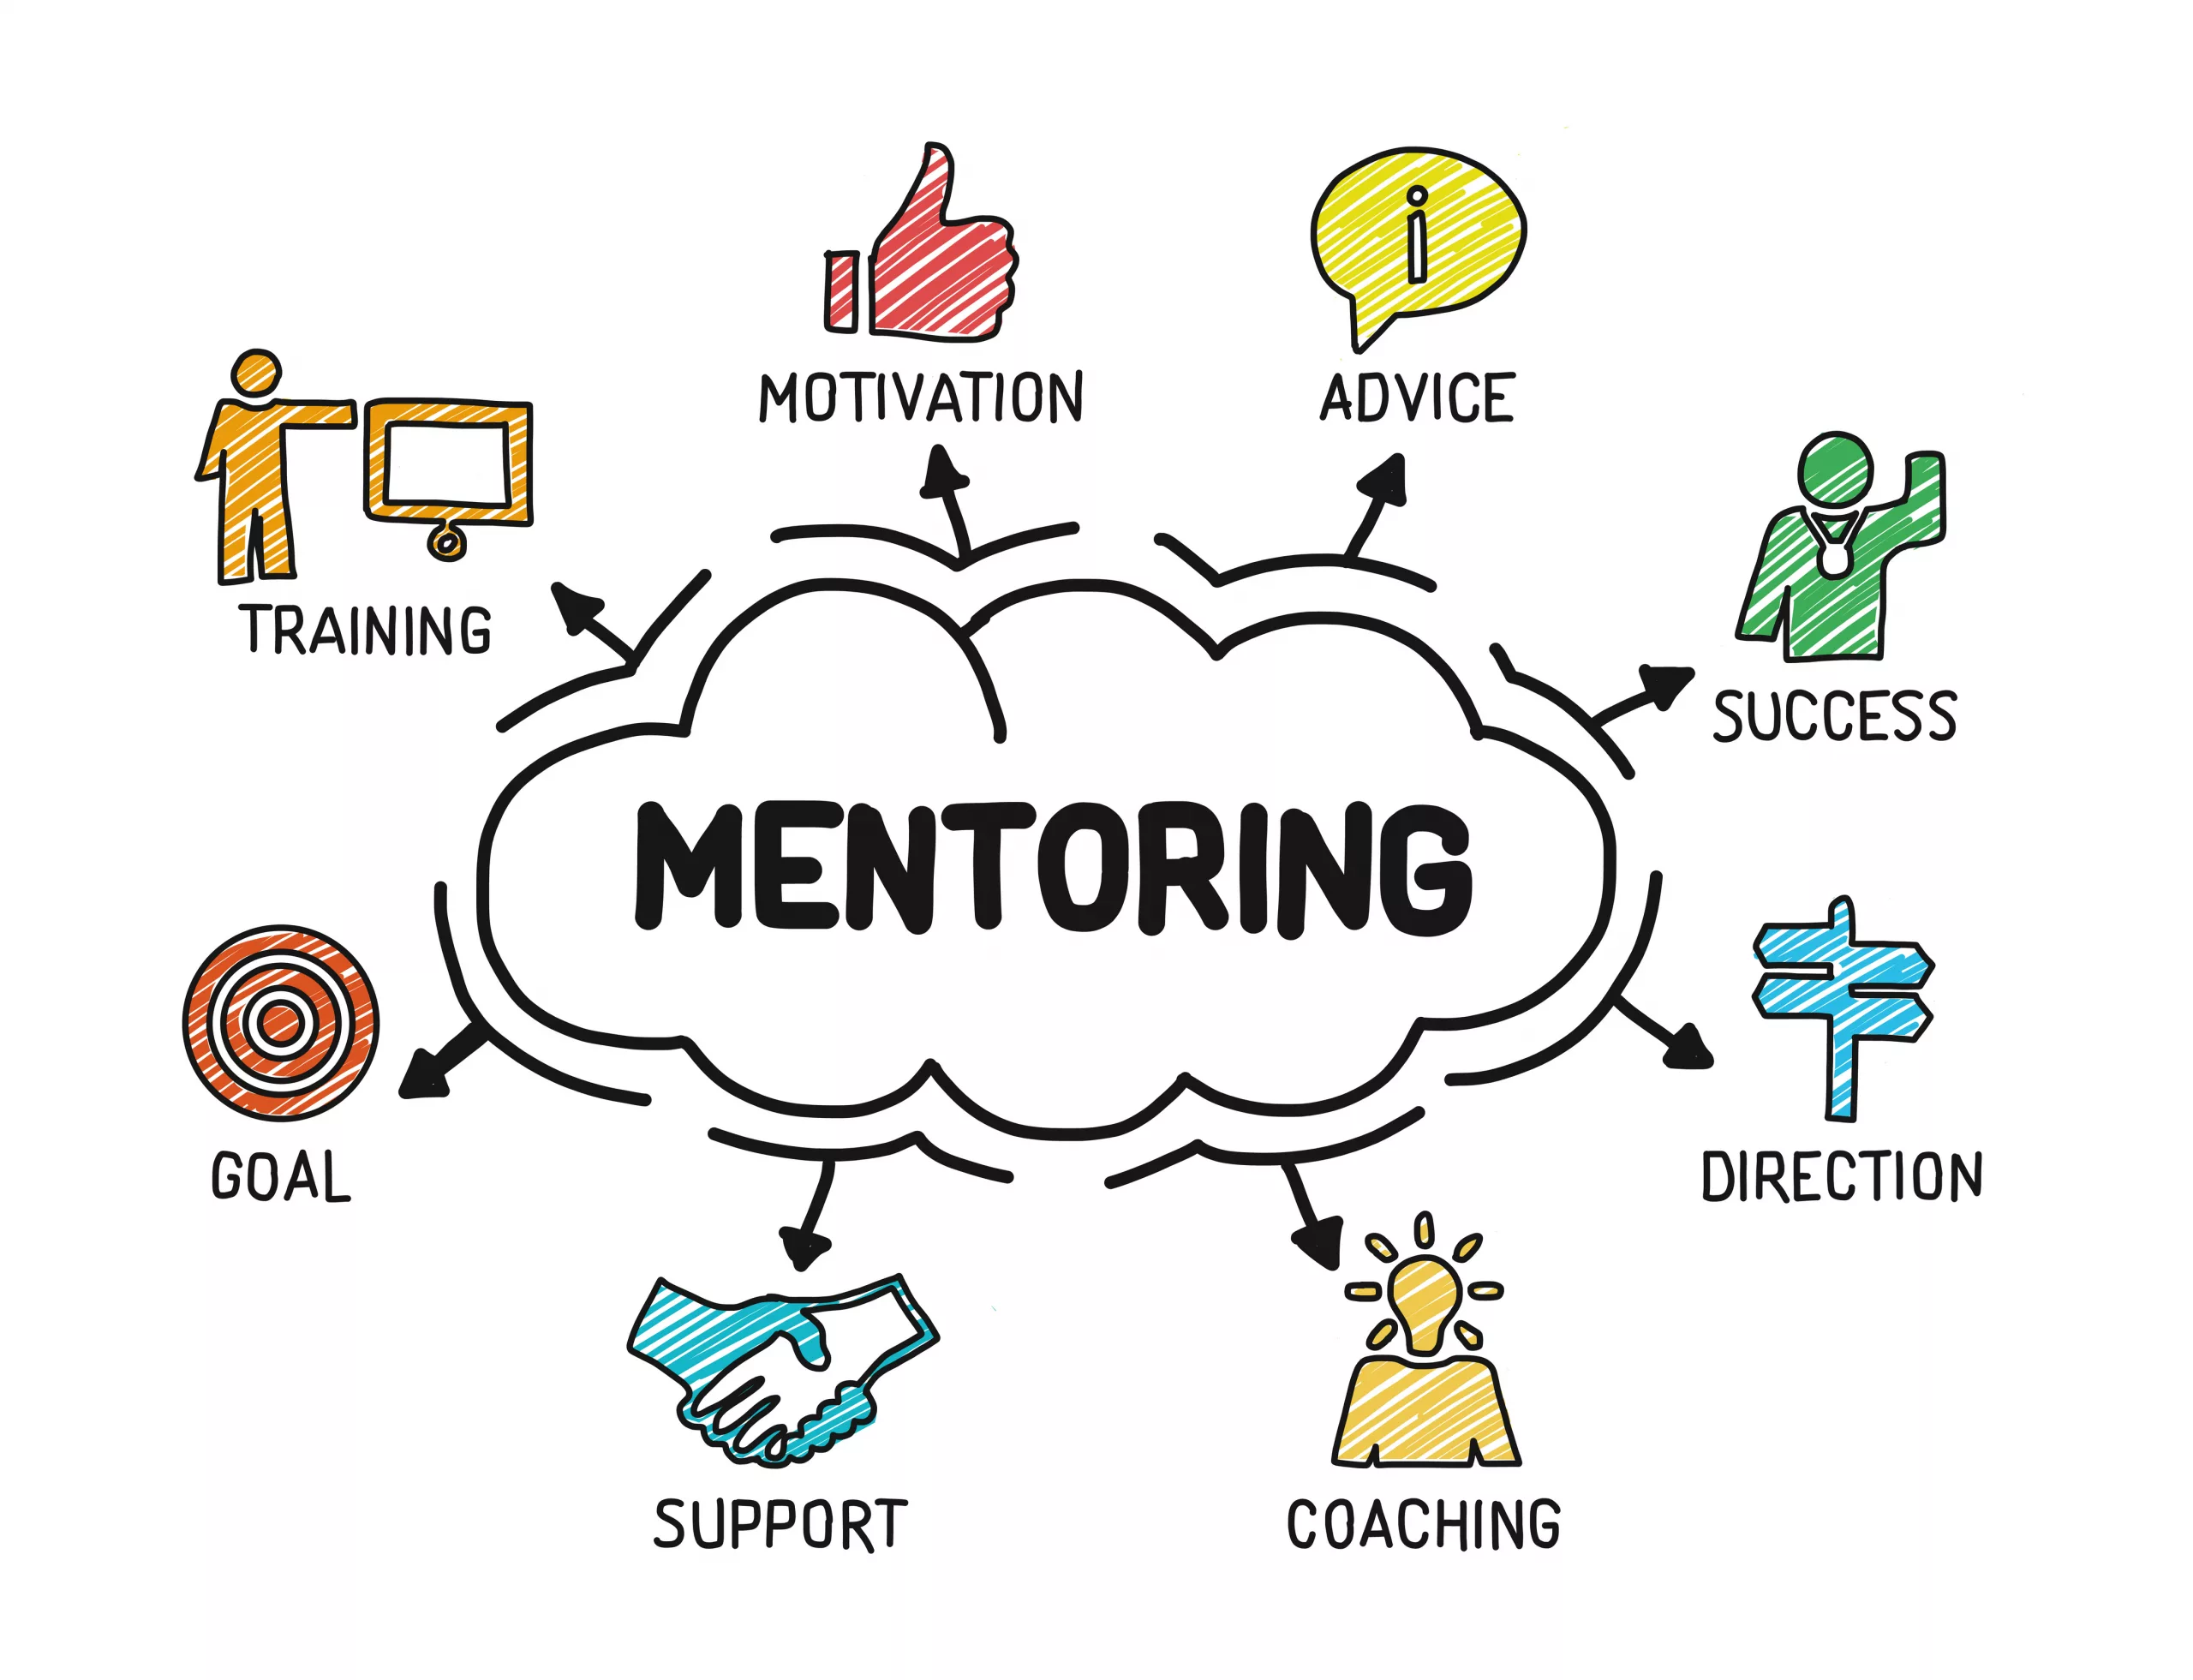
Seeking Clinical Mentors
As HCPs we are used to having mentors. We are assigned them in training programmes, trained to become them as part of our progression, and some workplaces offer ‘team leader’ style roles for continued mentorship post-training. But what about when we want advice on accessing career pathways that aren’t immediately available?
What about when we are thinking of reducing hours, changing contracts, trying different Trusts and don’t know anyone currently doing the same?
LinkedIn is a great tool – if people respond, and I have said for some time that if you look for someone doing what you would like to do, you will likely find them. The problem is, that doesn’t mean you can ask them how they got there, what courses were worthwhile (or are now worthwhile amidst constantly moving barriers like Trusts previously wanting level 3 certificates now wanting level 4, and evolving career maps), or how to get anyone in your chosen line of work to answer your enquiries.

Image: Little help with those steps, please. Image shows a hand holding a wooden block in place as a stair while a wooden man steps up to it. Paramedics are now working across a variety of fields, and as I have written recently, I believe that we may soon reach a point like other professions of working a generic few years before choosing specialist paths. However, I am aware that many are trying to work out which path is most suited to them, which one isn’t a dead-end and involves a good mix of a healthy shift pattern, interesting work, and career progression. It isn’t easy to choose when many pathways are new or still being developed. Some appear in one part of the country several months before they pop up in another and as most of us have experienced, the same pathway doesn’t necessarily look or feel the same in every Trust.
I believe that it should be easier for us to find mentors and support each other to answer simple questions like those written above. I hope to soon provide Article 999 mentors who will available to answer questions and offer guidance. These mentors will be working in a variety of specialised roles. They may have specialist interests that have become part of their career. Going forward, they may be able to provide more in-depth career discussions and advice, and some of them may be interested in collaborating on projects and ideas.

What does mentoring mean to you? Image shows people trying to climb up a series of blocks, receiving help from each other in the form of hands up and ladders. We as Paramedics do have the benefit of information and support available from unions and the College of Paramedics, but we don’t have an easy to access resource of helpful, responsive, qualified mentors who are there to help you:
- Progress
- Network
- Make informed career choices
- Make informed course choices to spend your money and time effectively and efficiently
- Find guidance (and perhaps inspiration) when you are unsure where to take your career or what is next for you.

Learning and leadership – two interconnected terms relating to mentoring If you are interested in becoming a mentor for Article 999 please email me at article999uk[at]gmail.com with your name, role (and registration number if you are registered), clinical background and experience, area of specialist interest(s), and mentoring experience and qualifications. Please note this is currently voluntary, but committed mentors will be contacted in the future as this project develops and grows. Mentors will also receive a certificate that could be used for CPD portfolios.
If you are interested in being mentored then please let us know by liking this post, commenting and/or sharing it.

Motivational quote “Leadership is unlocking people’s potential to become better” appearing behind torn blue paper. “Mentoring is a brain to pick, an ear to listen, and a push in the right direction.”
John C. Crosby
(one of many quotes that describe effective mentoring) -

Methods of ECG Interpretation
There are so many different recommendations of ECG Interpretation. Some books have 5 steps, some 6, some 9, some 11. Below, I have listed a few common ones in the hope of highlighting the differences – and the similarities. I have tried to focus on rhythm strip analysis only but some methods combine the rhythm strip with the 12 lead analysis. I have only included those that are publicly available, so although some fantastic methods are taught on courses, I can’t reference them and have subsequently omitted them. However, if you have a preference or believe one method should be included below, add it in the comments and it may be featured in a future update.
Method one:
From: Resuscitation Council, Advanced Life Support (2021: 106):
The 6 Steps of rhythm strip analysis:
1. Is there any electrical activity? (Or/and check a pulse)
2. What is the ventricular (QRS) rate?
3. Is the QRS rhythm regular or irregular?
4. Is the QRS complex width normal (‘narrow’) or broad?
—
5. Is atrial activity present?6. Is atrial activity related to ventricular activity and, if so, how?

Method Two:
From: Charles L. Till, Clinical ECGs in Paramedic Practice (2021: 16):
9 Steps – initially look at lead II, then look at every ECG lead:
ECG Steps
1. What is the rate and rhythm?
2. Are there any P waves and what is their relationship with the QRS complex?
3. What is the duration and morphology of the QRS complex?4. Is the ST segment isoelectric, depressed or elevated?
5. Are the QT intervals and T waves normal?
Clinical Steps
6. Is the heart generating a palpable pulse of appropriate rate and providing adequate perfusion?
7. Is the rhythm unstable and at risk of deterioration?
8. Does the presenting rhythm support or change your working diagnosis?
9. Are any clinical interventions required?
Method Three:
From: Paul Murray, East of England Ambulance Service, Version 1.0, ECG Recognition – Quick Reference Guide (Feb 2014: 1)
6 steps:
1. ‘QRS Rate’
2. ‘Is the QRS rhythm regular or irregular?’ (and regularly irregular or irregularly irregular?)
3. ‘QRS duration’
4. ‘Are P waves present?’
5. ‘Relationship between P waves and QRS – is there a P wave for each QRS and a QRS for each P wave?’
6. ‘Is the PR interval within normal limits 120-200ms and is it constant?’
(This is basically the same as the RC council method, with one added step; the RC method has one step at the start – a reminder to ensure the leads are connected properly and the patient is alive).
Method Four
From: Fred Kusumoto & Pam Bernath, ECG Interpretation for Everyone – An On-The-Spot Guide (2012: 33-36):
‘Assess the patient: symptoms and physical examination. Appearance, vital signs, physical examination’ ->
1. Is there a P wave in front of every QRS and is the rate between 50-100 beats per minute?
2. Are the ST segments isoelectric?
Each answer leads you to a different figure – an option to confirm you have a normal ECG, evaluation of ST segments, evaluation of arrhythmias, or confirmation time-critical patients.
The normal ECG should have:
1. Rate should be between 50 and 100bpm2. A P before every QRS (Positive P in lead II).
3. The QRS in V1 should be narrow an negative i.e. an Rs
4. The ST segment should be isoelectric
5. The T wave should be the same direction as the QRS
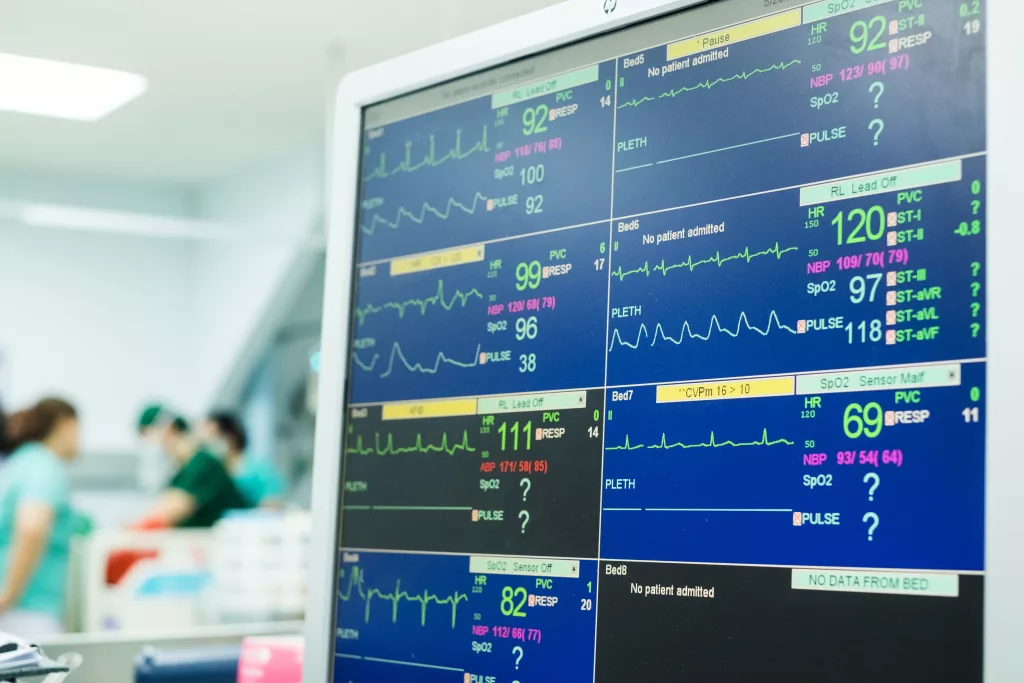
Method Five:
From: Kuhn, Lang, and Wiesbauer, ECG Mastery: The Simplest Way to Learn the ECG (2014: 141-142)
Summarised – 11 steps (taking you from rhythm analysis into 12 lead analysis. Steps included to highlight how some of the steps above are readdressed or appear later altogether here; other points may appear in front):
1. Rhythm. Criteria for sinus rhythm:- Are the P waves positive in I and II?
- Is there a QRS complex after each P wave?
- Are the PR intervals constant?
- Are the RR intervals constant?
Ask: Is it sinus?
2. Heart rate
3. P waves – atrial enlargement present?
4. PR interval
5. QRS axis
6. QRS duration
7. Rotation
8. QRS amplitude
9. QRS infarction signs
10. ST-T segment
11. QT duration, T-U waves
That’s it for today, though you may find other methods at useful courses such as Mark Whitbread’s ECG Bootcamp.
Do you have any recommendations, preferences, or opinions? Add them below!
-

How to Use Cling Film to Treat Burns (Fast Fact)
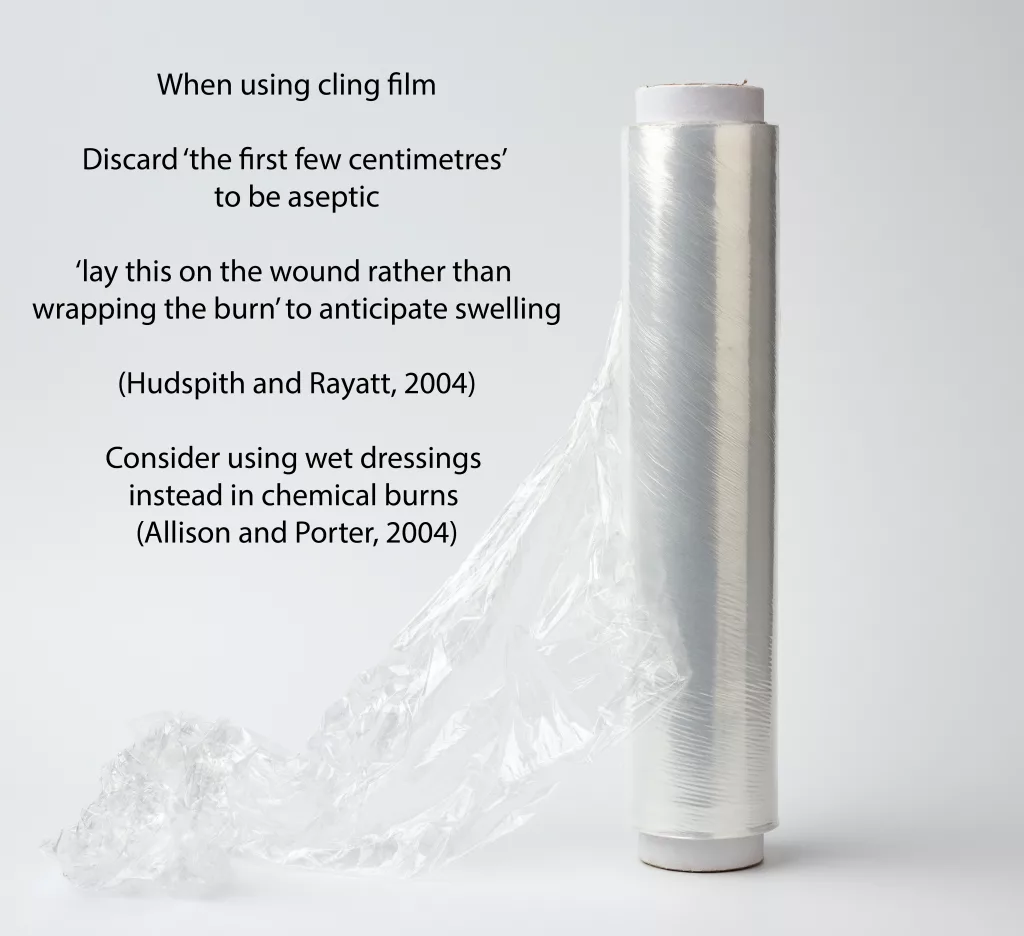
Fast Fact posts are designed to provide quick and easy ways to revise key topics – view a photo with a quote/fact by simply scrolling through the category. Refresh yourself during those middle-of-the-night breaks when you would have aimlessly scrolled through your phone. There is no need to read a lengthy post to do a little CPD. For more fast facts, head here.
-

ECG Concepts: The Importance of Time and Direction
Often basic ECG teaching relies on teaching pattern recognition, which can work well, however when presented with an ECG that isn’t similar to a pattern you have seen, you can run in to problems.
This article will explore two simple concepts that will hopefully help with your ECG reading and understanding of the underlying physiology:
Looking for help with a key term? Jump to them here:
Time
Let’s start with time. It seems simple enough.
It can be good to think of an ECG as a graph with an X and Y axis. X, horizontally along the bottom represents time. We’ll come to the Y axis later.
Now, we know that X is time, each small square is 40ms (0.04seconds), each large square is 200ms (0.2 seconds), 30 large squares is 6 seconds and so on. That’s reasonably straightforward, but how does it relate to physiology?
Let’s imagine that graph again. And let’s imagine some boxes drawn on. Don’t worry about the Y axis value for now.
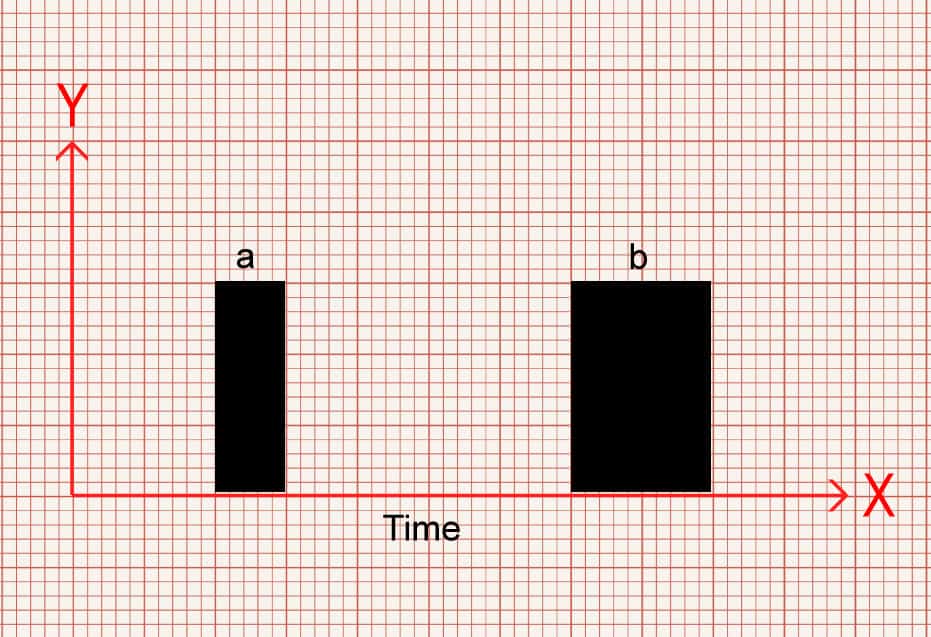
In image 1 you can see a narrow box (a) and a wider box (b). Which one would you say takes up more time? Which one takes up less time?
Box b takes up more of space along the X axis so therefore takes up more time. Box a covers less space on the X axis so takes less time.
Similarly, we can measure between two points. Look at Image 2. You can see two horizontal lines of different lengths. The gap between a – b is shorter than c -d. So again, which takes up more time?
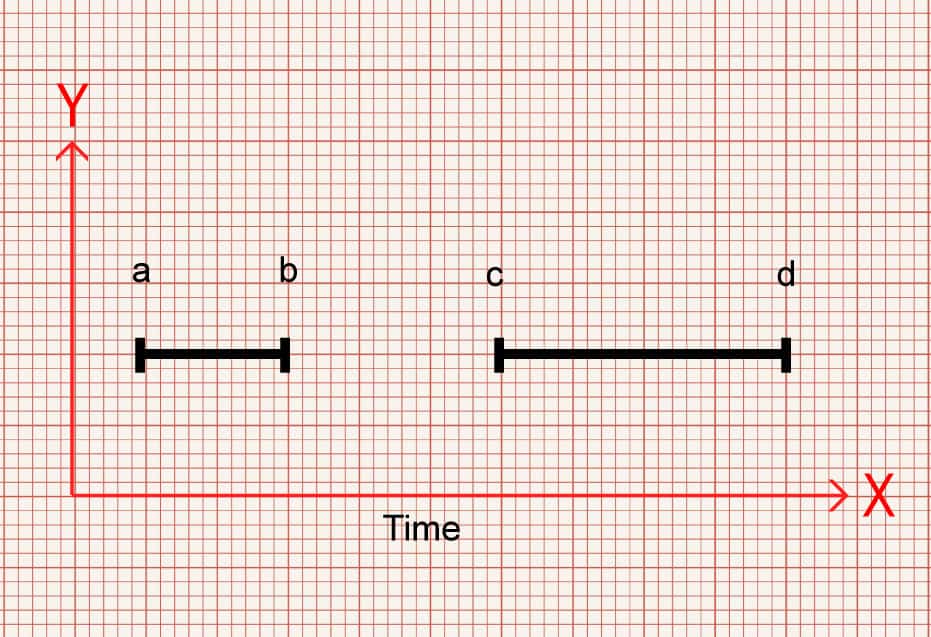
Gap c-d is wider, takes up more of the X axis and therefore takes up more time.
Stay with me.
Now, let’s replace those boxes with QRS complexes.
In image 3 there is a narrow QRS (a) and a wider QRS (b). Which one takes up more time?
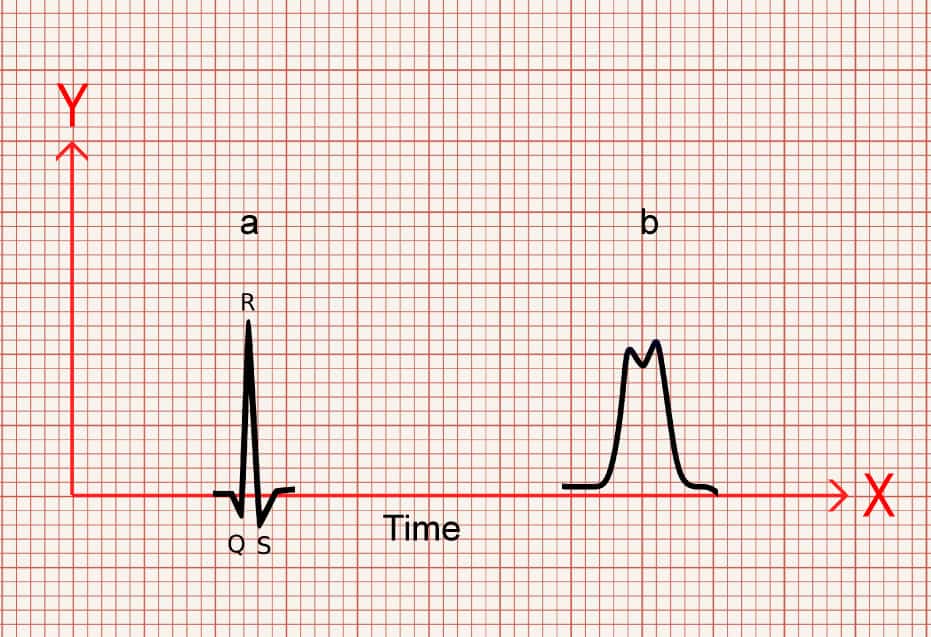
B is taking up more of the X axis so takes more time.
And again, once more, let’s look at some gaps between two points, but let’s show it as the gap between the P wave and QRS. Which one takes up more time and which takes up less time?
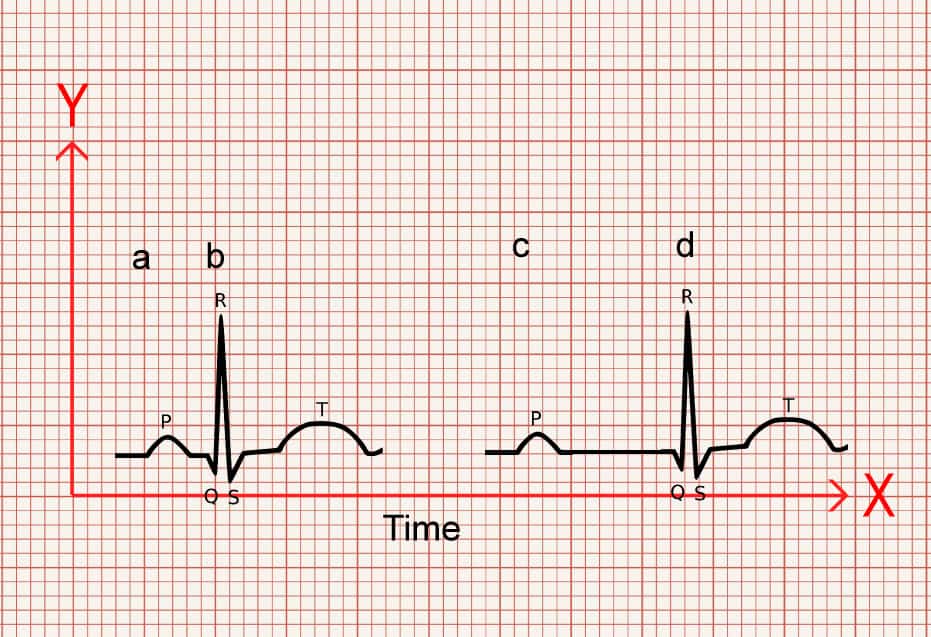
The gap between a-b is shorter than c-d.
So c-d takes up more time.
Probably not ground breaking.
But, what’s another way of thinking about the time something takes? If something takes up more time, you could also say that it is slower, and if something takes up less time, its faster.
Now, remember that an ECG is dealing with electrical conduction.
If on an ECG something is taking up more space along the X axis, therefore taking more time, and is therefore slower, then it makes sense that there is a problem effecting its ability to conduct!
And poor conduction is the underlying issue that what we see in AV blocks and bundle branch blocks.
So if you see a QRS or PR that is wider than normal values, think, something is causing it to be slower and that there is a conduction fault.
Equally if you see a PR interval that is narrower than it is meant to be, taking up less space along the x axis and therefore less time, think, it’s conducting faster than it should and it would alert you to pre-excitation problems, such as accessory pathways in Wolff-Parkinson-White syndrome (WPW effects both the PR interval making it shorter, and has a wider QRS).
Direction
Now, let’s talk about direction.
We know by looking at the ECG paper that vertically, the small boxes, measured in mm, represent millivolts (mV) – a measure of force (sort of). Each 1mm = 0.1mV, 10mm = 1mV. This also means that it has what’s known as magnitude – or size.
Now, let’s look at the graph again. We know the X axis is time, as discussed above. However, in an ECG the X axis is not simply the bottom, but instead the middle of the graph, with the Y axis extending both positively above the X, and negatively below the X axis.
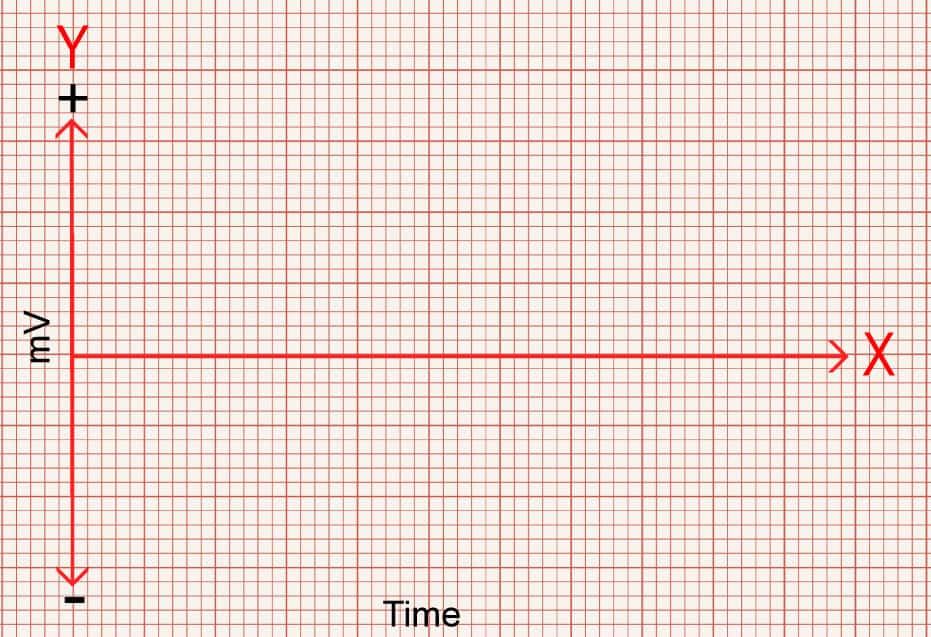
The X axis can have readings above or below it. This is the isoelectric line.
ECGs pick up electrical charge moving across the heart. And it does so by placing electrodes at different locations around the heart.
As shown in the diagram below, the electrodes create a view of the heart from different angles, and each view is called a lead. 12 leads (views), but only 10 wires.
The chest leads look at the heart across the transverse plane, that is from the front of the chest to the back, whereas the limb leads look at the heart in the frontal plane, which are essentially from the sides, top and bottom.
The angles the leads look at the heart are measured in degrees, with lead i being the reference point of 0°.
This is something that is worth learning so that you are able to visualise where each lead “looks”.
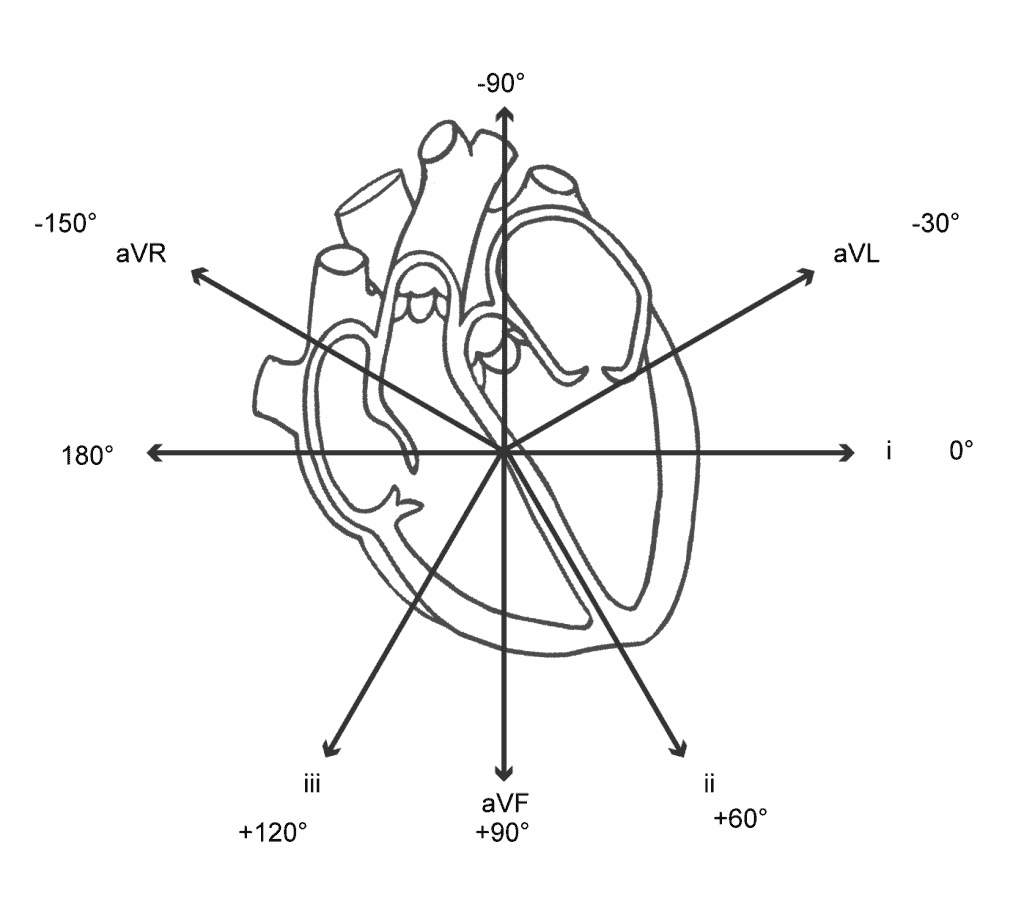
Roughly speaking, the limbs leads create the following views of the heart.
- avR – Looks from the Right shoulder to the left hip
- aVL – Looks from Left shoulder to right hip
- i – Looks from the left mid axilla similar to V6
- ii – Looks from the left hip to right shoulder
- aVF – Looks from the Feet up to the head
- iii – Looks from the right hip to the left shoulder
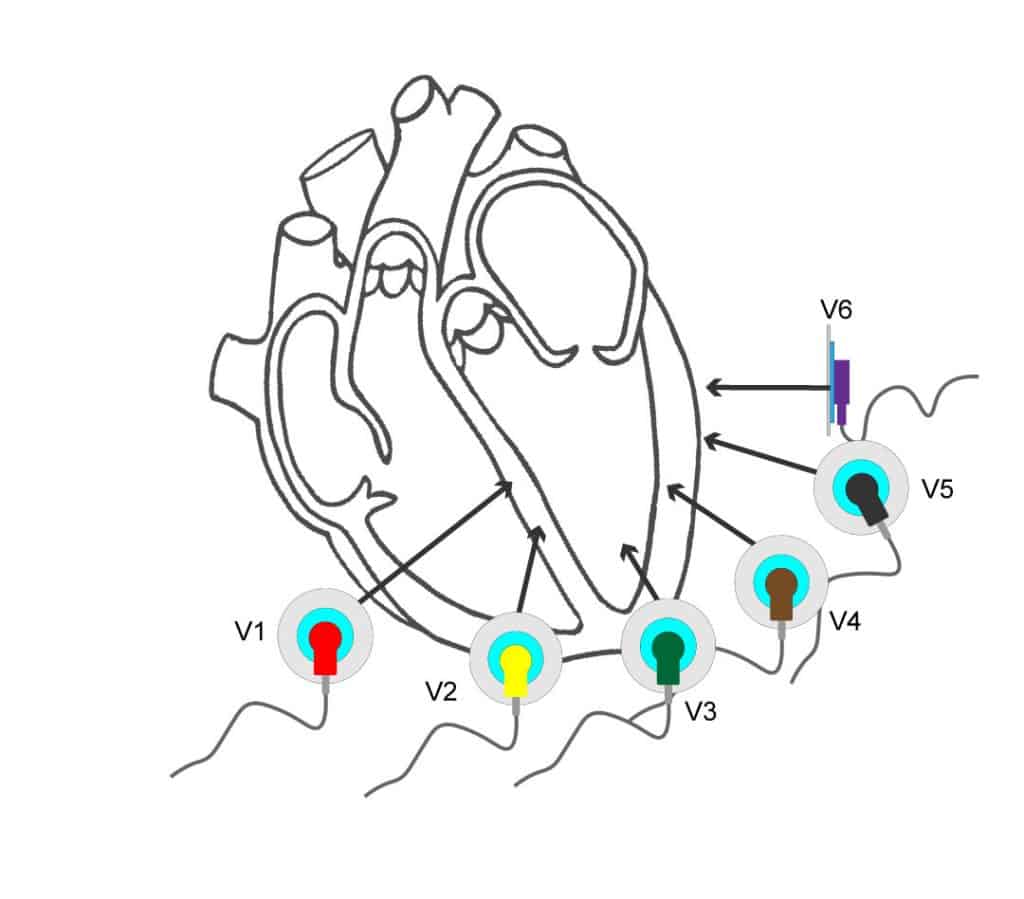
The chest leads create views from the chest wall through to the back
- V1 + V2 – intraventricular septum
- V3 – V4 – anterior wall of the left ventricle
- V5 – V6 – lateral wall of the left ventricle
Very simply put, as an electrical charge moves towards an electrode position, this creates a positive reading. As it moves away it creates a negative reading.


Electrodes that are opposite to each other, 180 degrees apart, will be mirrored. One will have charge moving towards it, creating a positive deflection and the opposite side will show a negative deflection as the charge moves away from it.
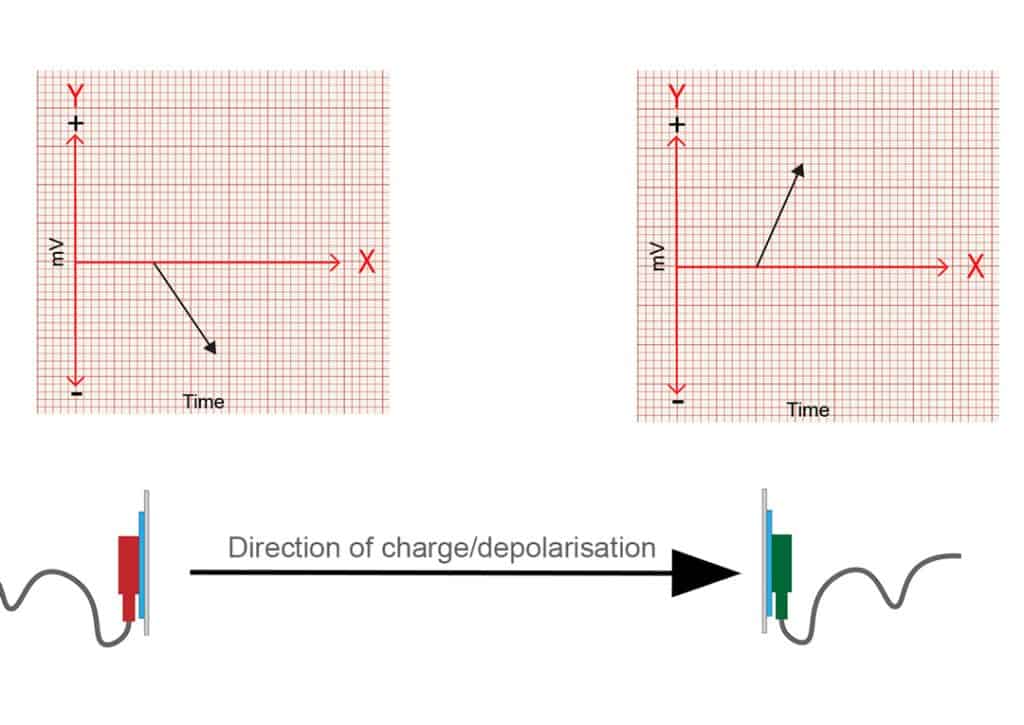
Leads at 180° from each other. Slightly more complicated is what happens when the electrical charge isn’t moving directly to, or away from the electrode, but when it is moving at more or less than 180 degrees to the electrodes position.
Let’s look at what happens when it moves at 90 degrees to the electrode first.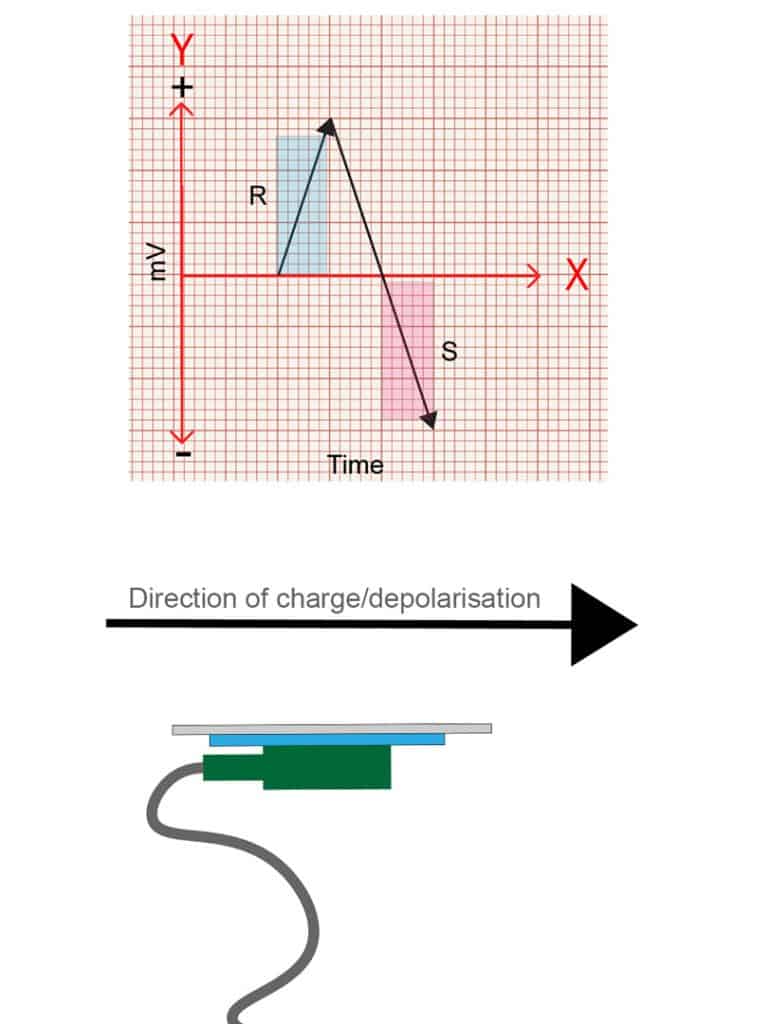
When the charge is moving at 90 degrees, or perpendicular, to the position of the electrode, it has both a period of positivity and a period of negativity, as the charge moves towards and then away from the electrodes position as it passes by. This is represented on an ECG as an R wave followed by an S wave of equal magnitude.
Quick tip – an R wave is any positive deflection you see, and an S wave is a negative deflection following an R wave BUT it must cross the isoelectric line to be considered negative. The segment from the top of the R wave back to the isoelectric line is not the S wave. The S wave is only the portion below the isoelectric line.
Hopefully this is starting show the relationship between the direction of the charge and the position of the electrode.
So, what happens if the charge moves at 45 degrees to an electrode’s position? Well, it’s a bit more towards the electrode than 90 degrees, but not straight on. So the tracing will show a predominately positive wave, with a smaller S wave. The opposite will be true if travelling at say 135 degrees away from an electrode.
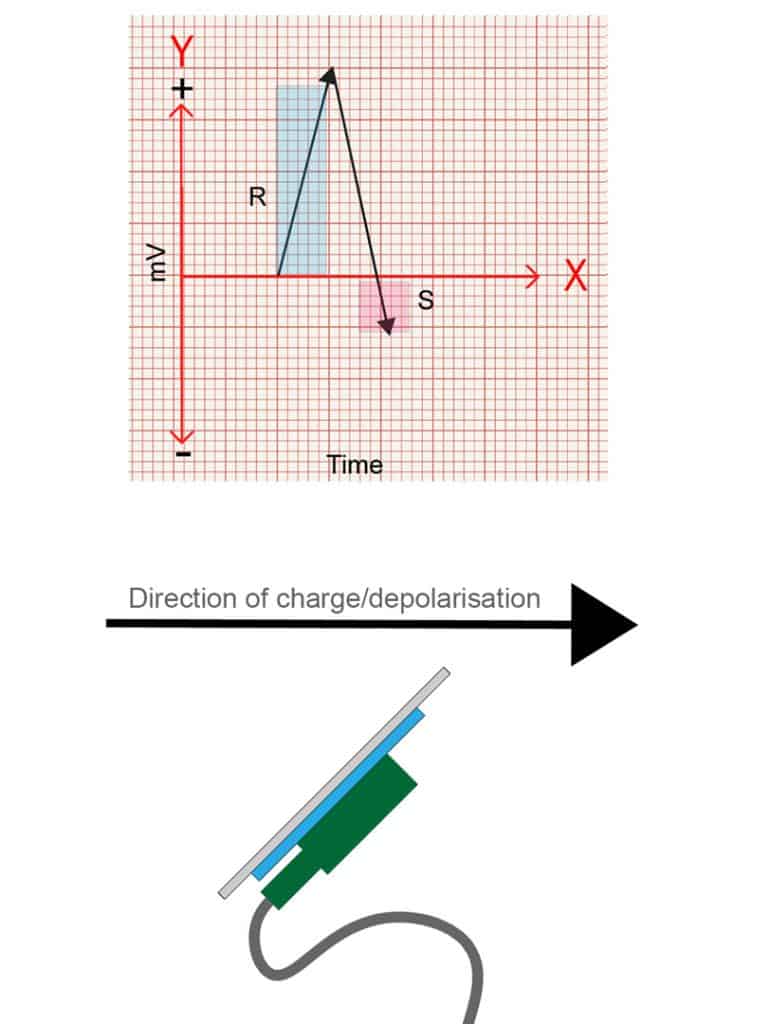
Hopefully you can see then, that by varying the direction the charge travels, you’ll get different combinations of positive and negative deflections, and that it is relative to the position of each lead/view!
This means that the waves on an ECG not only have a value in magnitude (mV), but also direction. This combination of magnitude and direction is known as a vector.
So not only can the ECG waves tell you the charge in volts, but it can also show you the direction that charge is moving relative to the electrode placement.
Why is this important?
Well, many of the pathologies we come across effect the direction the charge moves across the heart.
For example, in left bundle branch block (LBBB), the left conduction pathway is faulty. This means all of the electrical charge must come from the right side of the heart, and travels across the heart from right to left through the slower conducting muscle tissue.
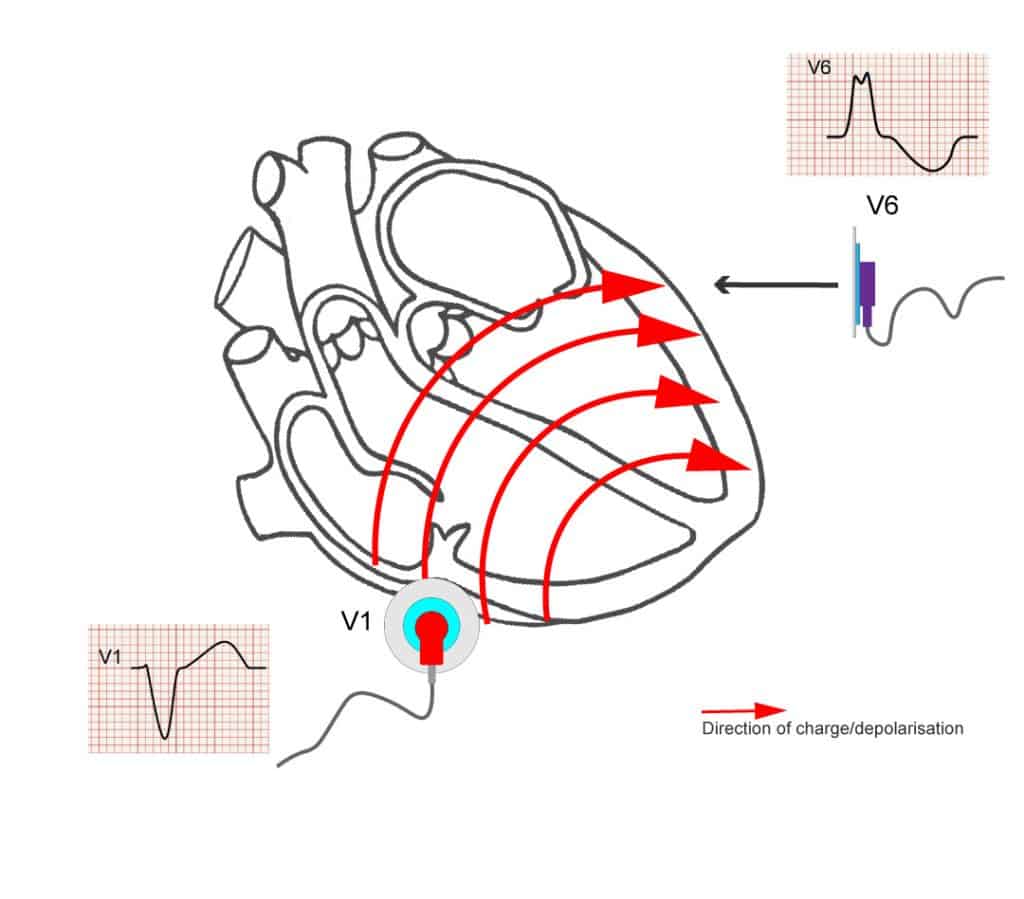
V1 looks at the right side of the heart, so, with right to left movement, the charge is moving , slowly, away from V1, giving the classic negative, deep S wave seen in LBBB.
Understanding the concepts of vectors is important if you want to understand axis deviation, reciprocal changes in STEMIs, left anterior and left posterior fascicular blocks, T wave inversions and strain patterns, and how to identify bundle branch blocks.
Final Notes
So, to sum up, understanding how time is displayed on the ECG will lead to better recognition of conduction faults. Understanding that the ECG shows both direction and magnitude means you can easily understand how that charge is moving across the heart. Couple this with further reading around the physiology and pathophysiology and your ECG interpretation should greatly improve!
Just as a final caveat: electrophysiology is complicated. This is a basic description of the principles and vectors, but the images are not exact examples. The detailed process of how the electrodes work, how the leads form their views, the physics behind it and so on are far beyond the scope of this article, but hopefully this has given some insight into the applied nature of ECG.
References
The above post is written by an Article999 contributor and contains a mix of original content and explanations based on the below sources. All images are combined from licensed Adobe Stock images and the author’s own work, as with all Article999 content.
Cadogan, M. And Buttner, R. 2022. ECG Axis Interpretation. Available at: https://litfl.com/ecg-axis-interpretation/ (Accessed 19/01/2023).Cadogan, M. 2021. PR Interval. Available at: https://litfl.com/pr-interval-ecg-library/ (Accessed 19/01/2023).
ECG Waves, n.d. Cardiac electrophysiology: action potential, automaticity and vectors. Available at: https://ecgwaves.com/topic/cardiac-electrophysiology-ecg-action-potential-automaticity-vector/ (Accessed 19/01/2023).
ECG Waves, n.d. Left Bundle Branch Block (LBBB): ECG criteria, causes, management. Available at: https://ecgwaves.com/topic/left-bundle-branch-block-lbbb-ecg-criteria-treatment/ (Accessed 19/01/2023).
ECG Waves, n.d. The ECG leads: electrodes, limb leads, chest (precordial) leads, 12-Lead ECG (EKG). Available at: https://ecgwaves.com/topic/ekg-ecg-leads-electrodes-systems-limb-chest-precordial/ (Accessed 19/01/2023).
ECG Waves, n.d. The QRS Complex: ECG features of the Q-wave, R-wave, S-wave & duration. Available at: https://ecgwaves.com/ecg-qrs-complex-q-r-s-wave-duration-interval/ (Accessed 19/01/2023).
Garcia, T. 2013. The Art of ECG Interpretation. 2nd ed. Jones and Bartlett Publications, Inc: Massachusetts.